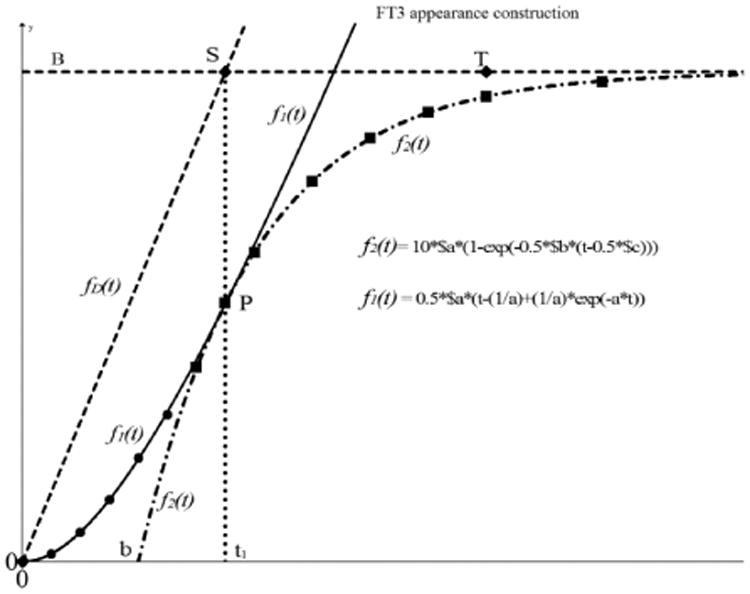
Fig. 7.

Construction of the [FT3] appearance based on measured data points. The first phase of the construction is based on the estimated data points from t > t1 (squares) This results in the fitting for f2(t) indicated as dash - dot line which intersects with y = 0 in t = b. We use the obtained value of τ of f2(t) to find a fit over the first series of measured points (round) f1(t) from which we obtain the amplitude factor A. With the extracted parameters B, a, and b from f2(t) and the amplitude factor A of f1(t) we calculate the time t1 to find the point P where f2(t) is taking over from f1(t). Furthermore, we find point S(t1, B). The driving function f(t)D is then indicated as the dashed line from (0,0) to S. Point T marks the end of the appearance process also known as tmax.
