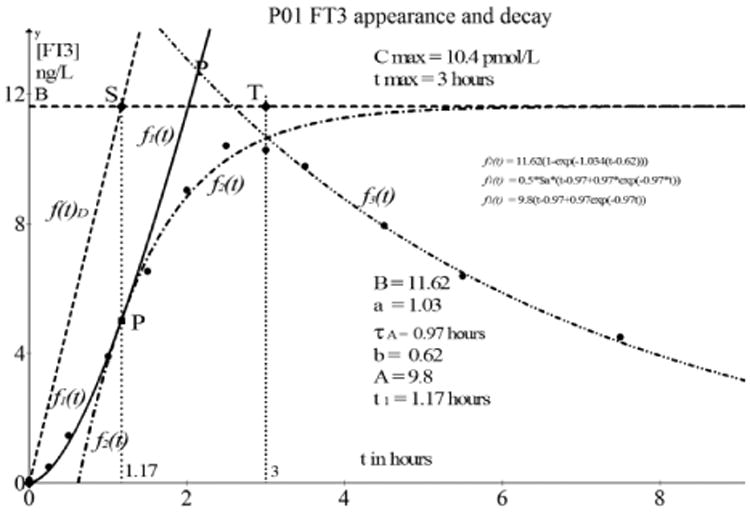
Fig. 8.

[FT3] appearance and decay as observed in participant P01. The solid line of f1(t) starting at (0, 0) has a fitting quality of R2 > 0.95. Similarly, we find a fitting quality of R2 > 0.95 for the continuation of the appearance function f2(t) indicated with the dot dash line.
