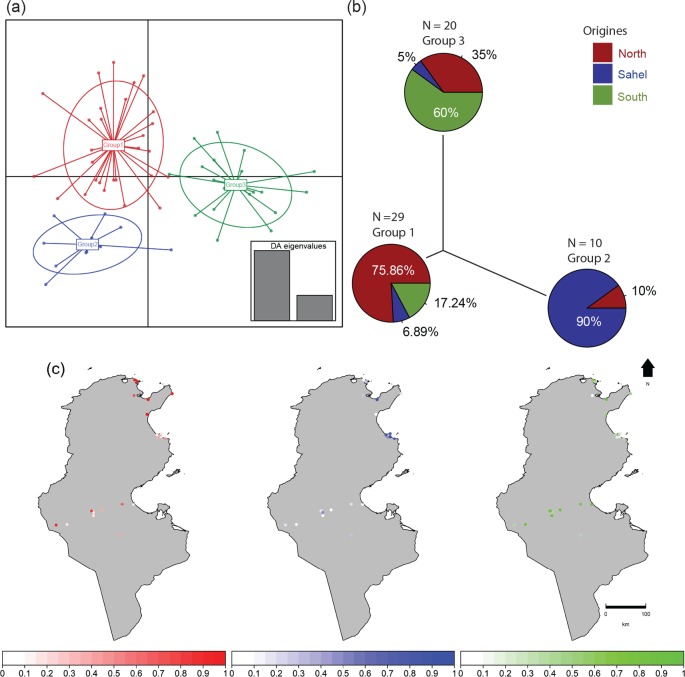
Fig 3. Discriminated analysis of principal components (DAPC) using SSR-based genotypes.
(a) DAPC first and second ordination axes. (b) Neighbor-joining tree constructed on the DAPC distances representing the genetic relationship between the inferred 3 clusters as well as the distribution of geographic groups within each of them. (c) Location of the populations (points) and their probabilities for membership in each geographic groups. The colors correspond to the genetic clusters defined by the DAPC analysis.

