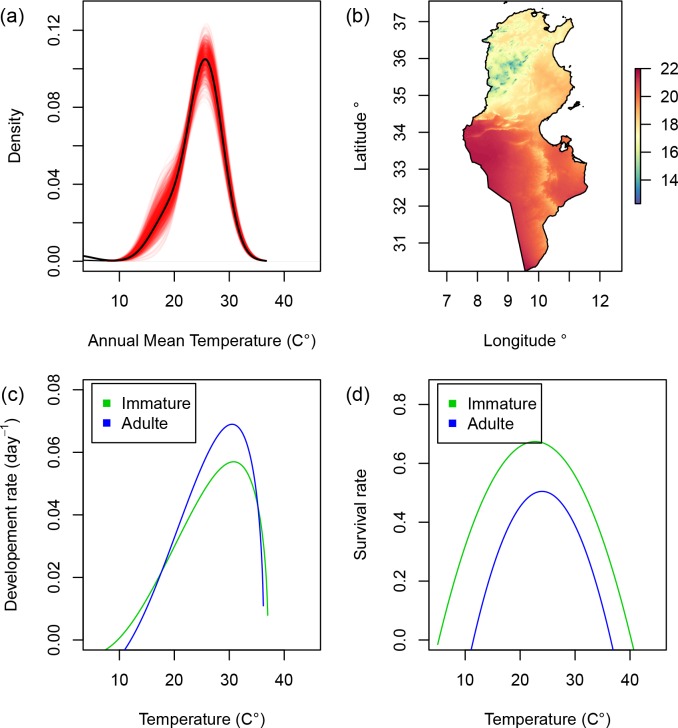
Fig 4.
(a) Gaussian kernel density estimates of annual mean temperature values within occurrence data. Red lines represent the result of 1000 permutations based on random samples of the initial occurrence data (70%). (b) Annual mean temperature map. (c) Development rate and (d) survival rate curves as a function of temperature (in°C) for immature and adult whiteflies estimated by [7].

