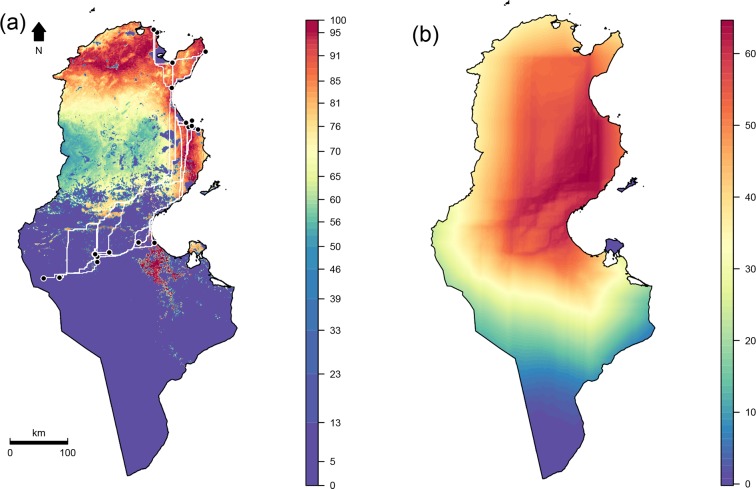
Fig 5.
(a) Habitat suitability map of Bemisia tabaci reflecting climatic and host/prey constraints. The color gradient represent an habitat suitability index (high values indicate high habitat suitability). White lines represent the shortest path between each pair of genetically related samples. (b) Map of potential migration corridors between sampled populations. The color gradient represent a connectivity index (high values facilitate gene flow and low values indicate low populations connectivity).

