. 2017 Sep 12;6:e28836. doi: 10.7554/eLife.28836

Figure 2. Biochemical analysis of asymmetric nucleosome formation in vivo.

(A) Schematic for in vivo biochemical analysis of H3X dimerization. Yeast strains expressed biotin-tagged H3X along with tagged H3X and H3Y, as indicated. (B) Immunoblot analysis of biotin-H3X partners. For each of the indicated antibodies (Myc or V5, the same blot was probed sequentially), the left two lanes show total DMS-crosslinked, MNase-digested chromatin (Input), and right lanes show streptavidin-precipitated biotinylated-H3 (Bound). Arrow indicates the expected size (31 kD) of crosslinked H3-H3 dimer species – note that biotin-H3 molecules crosslinked to H4 would not be recognized by the anti-epitope antibodies used for Western blot analysis. Asterisk indicates monomeric H3 molecules – presence of V5-tagged H3X (left panel) at this position in the bound fraction reflects bead contamination by uncrosslinked H3 molecules. Full gel, including unbound material and DMS control, is shown in Figure 2—figure supplement 2. (C) Quantitation of the amounts of the crosslinked 31kD H3-H3 dimers precipitated with streptavidin-agarose for second-generation H3X variant 126A. The mean and standard deviation for three independent replicate experiments are shown. (D–F) As in (A–C), but for biotin-tagged H3Y. As above, the homodimer signal (Myc, right panel) at 31kD in the bound material was almost undetectable, while V5-tagged H3X/H3Y heterodimers were readily detected. The mean and standard deviation for three independent replicate experiments are quantitated in panel (F).

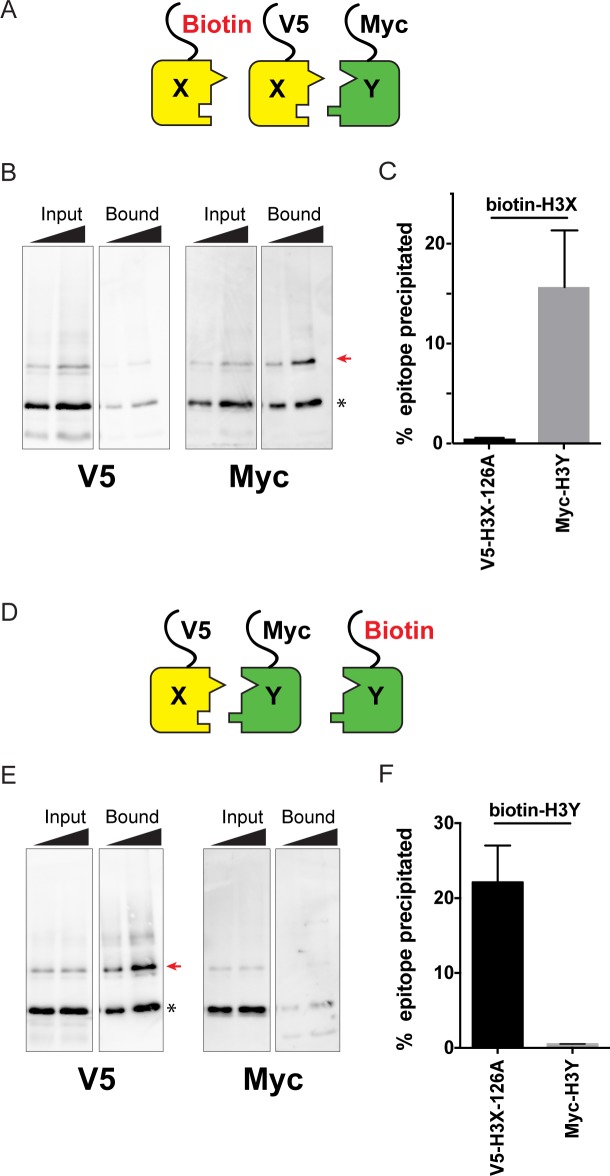
Figure 2.

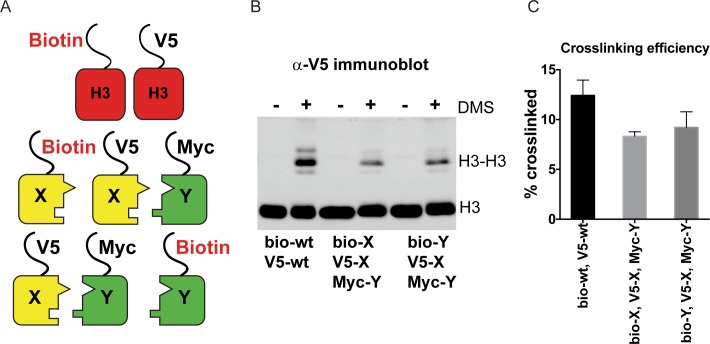
Figure 2—figure supplement 1. DMS crosslinking efficiency.

Figure 2—figure supplement 1.

(A) Schematic for in vivo biochemical analysis of H3 dimerization. Yeast strains used were PKY4616 (top, biotin-tagged wild-type H3 +V5 tagged wild-type H3), PKY4625 (middle, biotin-H3X + V5-H3X + Myc-H3Y), and PKY4694 (bottom, biotin-H3Y + V5-H3X + Myc-H3Y). (B) Immunoblot analysis of strains shown in (A). Whole cell extracts after 0 or 60 min of DMS crosslinking (- DMS or +DMS, respectively) were separated by 17% SDS-PAGE, transferred to a membrane, and probed with anti-V5 antibody. (C) Quantitation of the dimer/monomer ratio of H3 proteins after DMS crosslinking. The mean and standard deviation for three independent replicate experiments are graphed.
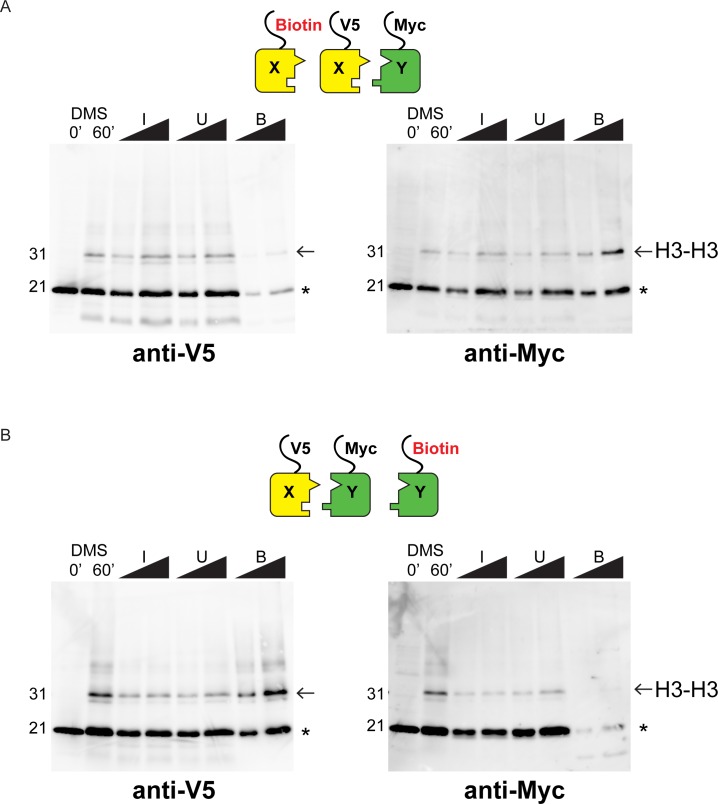
Figure 2—figure supplement 2. Western blot analysis of asymmetric nucleosome formation in vivo.

Figure 2—figure supplement 2.

(A) Immunoblot analysis of Biotin-H3X126A strain. Lanes 3–4 and 7–8 from these gels are reproduced in Figure 2B,E. Lanes 1–2: whole cell extracts after 0 or 60 min of DMS crosslinking. Lanes 3–8: DMS-crosslinked, MNase-digested chromatin from the indicated strains was precipitated with streptavidin-agarose to capture biotinylated (Bio) H3. I = Input, U = Unbound: 0.75% and 1.5% of total shown in adjacent lanes; B = Bound: 10% and 20% of total shown. Proteins were separated by 17% SDS-PAGE, transferred to a membrane, and probed sequentially with the indicated primary antibodies. Arrow indicates the expected size of crosslinked H3-H3 dimer species, while asterisk indicates monomeric H3 molecules – presence of V5-tagged H3X (left panel) at this position in the bound fraction reflects bead contamination by uncrosslinked H3 molecules. (B) As in A, for biotin-H3Y.