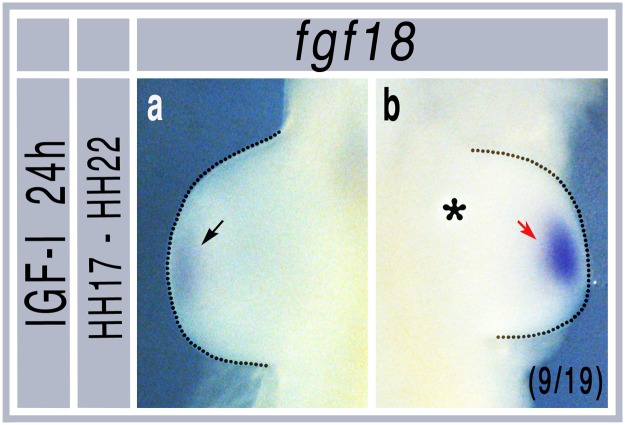
Fig 6. Increased Fgf18 expression following IGF-I bead grafts.
a) non-grafted limb showing normal expression domain of Fgf18 at HH stage 22. b) increased Fgf18 following IGF-I bead grafting. Asterisk shows position of bead. Red arrow shows region of increased Fgf18 mRNA. Numbers in brackets indicate the number of similar embryos out of total number of grafts.

