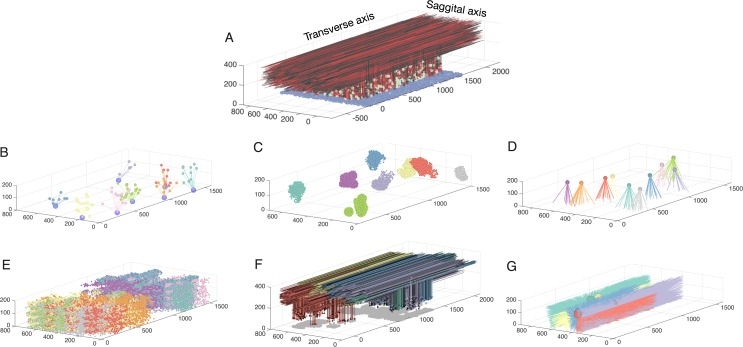
Fig 1. Network connectivity for all populations in the granule layer model.
A: The completely assembled network showing 10% of all GrCs and parallel fibers (red shades), along with all GoCs (green) and all mossy fibers locations (blue). The following panels always show subsets of model elements to demonstrate their specific connectivity. B: Example of 7 mossy fibers diverging onto GoCs. C: The GrCs contacted by 8 different mossy fibers through rosettes (color coded by mossy fiber identity). D: Mossy fibers converging onto different GoCs (one color per Golgi cell). E.: GrCs inhibited by different Golgi cells (each color represents one Golgi cell). F: Ascending axons and parallel fibers relating to 5 different mossy fibers (each color represents one mossy fiber) G: Parallel fibers from granule cells, which converge onto different GoCs (each color represents one Golgi cell).

