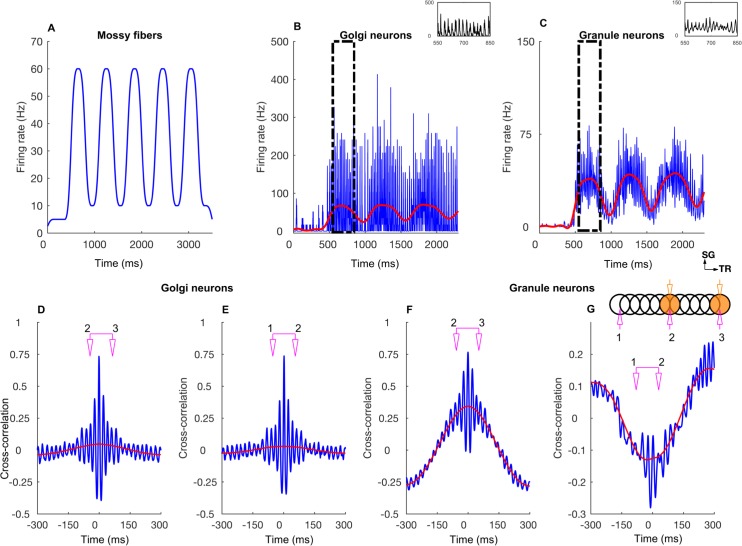
Fig 5. Network response to slow rate modulated mossy fiber inputs activated in two patches along the transverse axis.
A: Average mossy fiber firing rate in the ON patches, alternating between 10 and 60 Hz. B: Average GoC firing rate within the ON patches. The inset is a zoomed view of the boxed region. The blue trace represents the firing rate computed with a 1 ms time bin. The red trace is obtained by low-pass filtering (< 10 Hz) the blue trace. Membrane potentials of example cells are shown in S1E and S1F Fig. C: Same as B for GrCs. Membrane potentials of example cells are shown in S1G and S1H Fig. D: Cross-correlation function (CCF) between GoC firings in two ON patches separated by 500 μm along the transverse axis. The blue and red curves represent which data the CCF is computed from and follows the same scheme as B and C. The scheme in pink refers to the recording electrode setup shown in the inset of G. E: CCF between GoC firings in an ON and OFF patch separated by 500 μm along the transverse axis. Same color conventions. F, G: Same as D and E for GrCs, respectively. The stimulation and recording configuration shown as inset in G follows the same scheme as the one in Fig 2.

