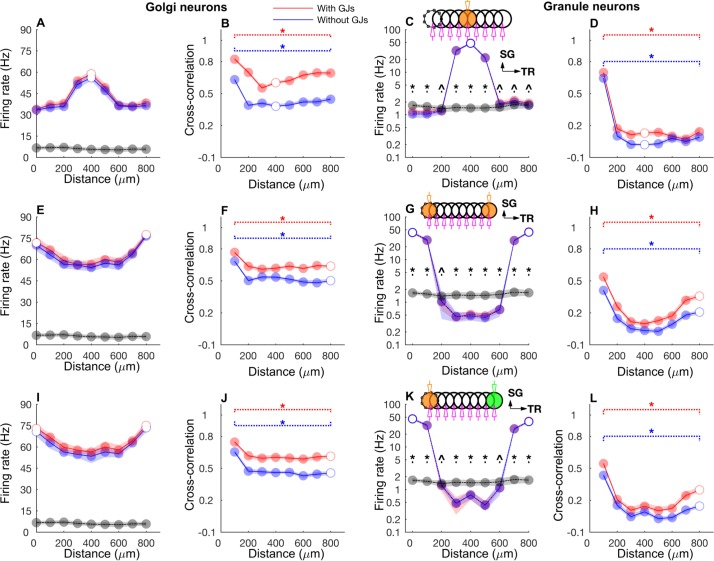
Fig 6. Firing rate and cross-correlations along the transverse axis.
A-D: GoC firing rate (A), cross-correlation (B), GrC firing rate (C), cross-correlation (D) along the transverse axis when the network was activated with a single patch of mossy fibers with slow rate coded input. Black lines and gray dots represent background network firing rate for the respective patches. Where red (simulations with gap junctions) and blue data (without gap junctions) overlap perfectly, the colors are added resulting in purple. Broken lines in B and C indicate significant correlation throughout the entire range of the data. E-H: Same as A-D for the network activated with mossy fibers in two ON patches separated by 800 μm along the transverse axis. The same rate modulation was used for mossy fiber inputs in both patches. I-L: Same as E-H, while rate modulation in one of the patches followed the same time course but had different a peak rate of 50 Hz which is marked by green color in the inset in K. Asterisk and triangle represent significant (p<0.01) and insignificant correlation (p> = 0.01), respectively in B, D, F, H, J and L. Similar symbols were used to show the results of two tailed t-tests comparing activity in each patch between patch activation and background activation data in C, G and K. The stimulation and recording configuration shown as inset in C, G, and K follow the same scheme as those in Fig 2. Beaded circle represents the reference patch with which the correlation of every other patch is computed. Data are mean±standard deviation.

