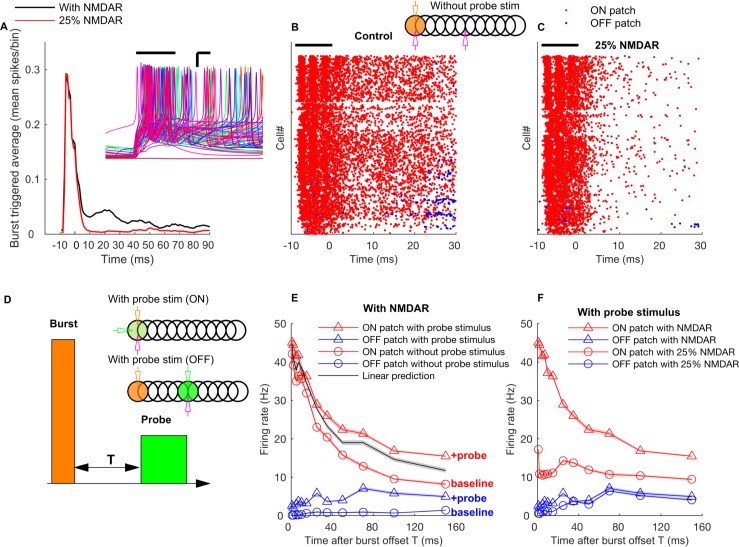
Fig 12. NMDA receptors mediate long-term gain increase in ON patch GrCs.
A: Burst triggered average firing rate of the ON patch GrCs with normal or reduced conductance of NMDA receptors. Results shown in the absence of probe input. Time zero corresponds to the end of the mossy fiber burst. Inset represents membrane potential traces of representative ON patch GrCs in response to bursting mossy fiber input. Scale bar: x-axis = 3 ms, y-axis = 15 mV. B: Raster plot of firing of GrCs in ON (red) and OFF patch (blue) in the absence of probe input. C: Same as B, with conductance of NMDA receptors reduced by 75%. D: Schematic representations of the burst input and probe input. The probe input is presented ‘T’ ms after the burst offset. E: Mean firing rate of ON patch and OFF patch GrC population during the asynchronous probe input versus time after the burst offset. Firing rates without a probe input and a prediction assuming no gain change are also shown for comparison. F: Mean firing rate of ON patch and OFF patch GrC population with normal and with reduced NMDA conductance during the probe input versus probe input onset time after the burst offset. In A, B, and C, solid line represent burst duration. The inset in B and D represents the stimulation and recording configurations in the same way as in Fig 9 while green color here represents the probe input.

