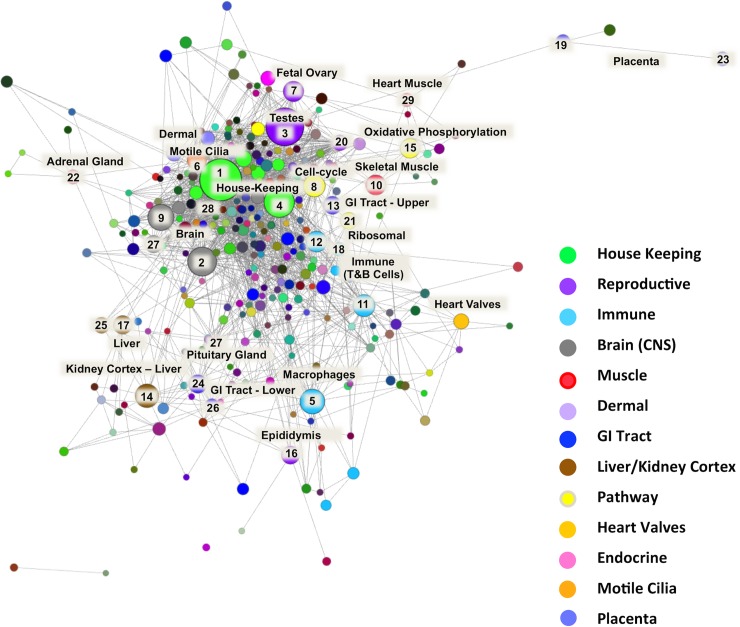
Fig 3. Collapsed node visualisation of the sheep gene expression atlas dataset in two-dimensions to illustrate the relative proportion of genes in each cluster.
Includes 3104 nodes and 138,407 edges with a Pearson correlation value of r = 0.75 and an MCL inflation (MCLi) value of 2.2. Nodes are coloured by tissue/cell type or for broader classes organ system. The largest clusters are numbered from 1 to 30 (see Table 3 for functional annotation). The largest clusters are dominated by either house-keeping genes (1 & 4) or genes associated with transcriptionally rich tissues or cell types, such as brain (2), testes (3) and macrophages (5).

