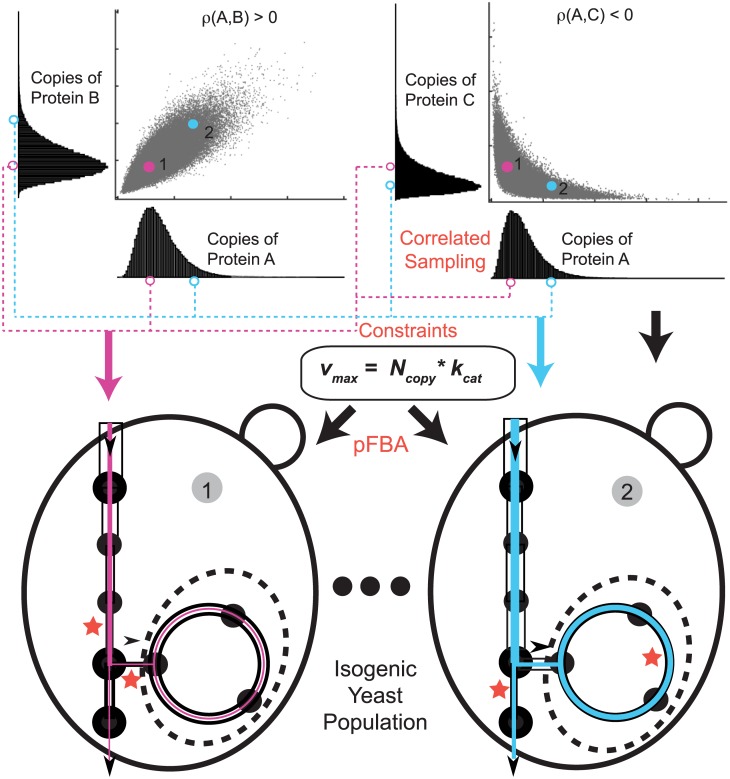
Fig 1. Population FBA methodology with correlated protein sampling.
An isogenic population of yeast is created by correlated sampling of distributions of metabolic proteins obtained from fluorescence microscopy experiments. ρ(x,y) represents Pearson correlation coefficient between the proteins x and y. Assuming Michaelis-Menten kinetics whereby vmax = Ncopy × kcat (where Ncopy is protein copy number and kcat is the turnover number of the protein) the sampled enzyme copy numbers are used to impose upper bounds (vmax) for the possible flux through their associated reactions. The correlations are obtained from microarray expression data. For two representative cells, the black hollow bars represent vmax values imposed on the reactions of an idealized network, while the solid color lines represent the actual flux that would be predicted to flow through the network. In each case, certain reactions, marked with red stars, constrain the flux through the network. Parsimonious Flux Balance Analysis (pFBA) [10] is used to calculate growth rate and flux distributions for each of the member of the population.

