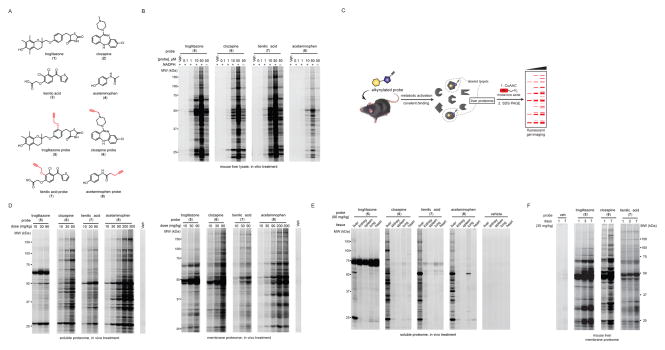
Figure 1.
Structures and initial profiling of the reactivity of chemical proteomic probes for hepatoxic drugs. (A) Structures of the parent hepatotoxic drugs (1–4) and their corresponding alkyne-modified (clickable) probes (5–8). The alkyne functionality was incorporated at sites intended to minimize interference with the known routes of metabolism of the drugs; see Figure S1 for more details. (B) In vitro reactivity profiles for probes 5–8 in mouse liver lysates with or without NADPH. Freshly prepared mouse liver proteome (2 mg/mL) was treated with DMSO or indicated probes (0.1–50 μM, 2 h, room temperature), and protein reactivity events analyzed by CuAAC with an azide-rhodamine tag followed by SDS-PAGE and in-gel fluorescence scanning (fluorescent gels shown in grayscale). See Figure S2A for a lower intensity image of the gel. (C) Schematic for chemical proteomic workflow used to profile the in vivo reactivity of probes 5–8. Following treatment with vehicle or probes (i.p., 2 h), mice were sacrificed and liver proteomes prepared and analyzed for protein reactivity events as describes in part B. (D) Concentration-dependent reactivity of mouse liver soluble (left) and membrane (right) proteomes following treatment of mice with vehicle or probes 5–8 (i.p., 2 h) at the indicated doses. The dosing range for probe 8 was extended into the acute hepatoxic range for acetaminophen (300 mg/kg). (E) Proteomic reactivity of five tissues from mice treated with vehicle or probes 5–8 (i.p., 90 mg/kg, 2 h). Data shown are for soluble proteomes; see Figure S2B for membrane proteome reactivity data. (F) Proteomic reactivity of liver from mice treated for the indicated number of days with vehicle or probes 5–7 (30 mg/kg, i.p., once daily). Data shown are for membrane proteomes; see Figure S2C for soluble proteome reactivity data.

