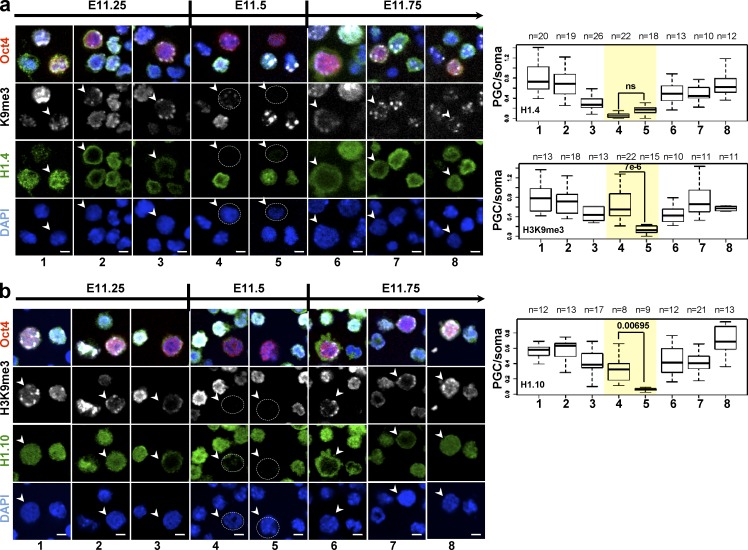
Figure 2.
H1 subtypes are transiently lost from chromatin during epigenetic reprogramming in mouse germ cells. (a and b) Kinetics of H1.4 (a; green) and H1.10 (b; green) disappearance from PGCs isolated from genital ridges of embryos between E11.25 and E11.75 (according to the TS system; see Materials and methods) and stained with anti-Flag antibody or anti-H1.10 specific antibody. An anti-OCT4 antibody (red) was used as a germ cell–specific marker (arrowheads). Dotted circles indicate PGCs with undetectable H1 signal. Bars, 10 µm. Changes in H1 abundance and localization are shown in comparison to the previously described changes in H3K9me3 pattern (Hajkova et al., 2008). Representative images from at least four different genital ridges from two to three independent litters are shown. The box plots (right) in a and b show quantification of the immunostaining signal for the indicated H1 subtypes and of H3K9me3 in OCT4-positive cells relative to OCT4-negative cells (PGC/somatic cells) during the different phases (1–8) of epigenetic reprogramming. The kinetics of H3K9me3 disappearance is similar for all the H1 subtypes; hence only data for H1.4 is shown. The number (n) of cells analyzed is indicated. To highlight differences in the kinetics of disappearance of H1.10 compared with H1.4 (yellow shaded rectangle), only the p-values for stages 4 and 5 are shown; ns, not significant. Error bars correspond to the minimum and maximum values.

