Figure 2.
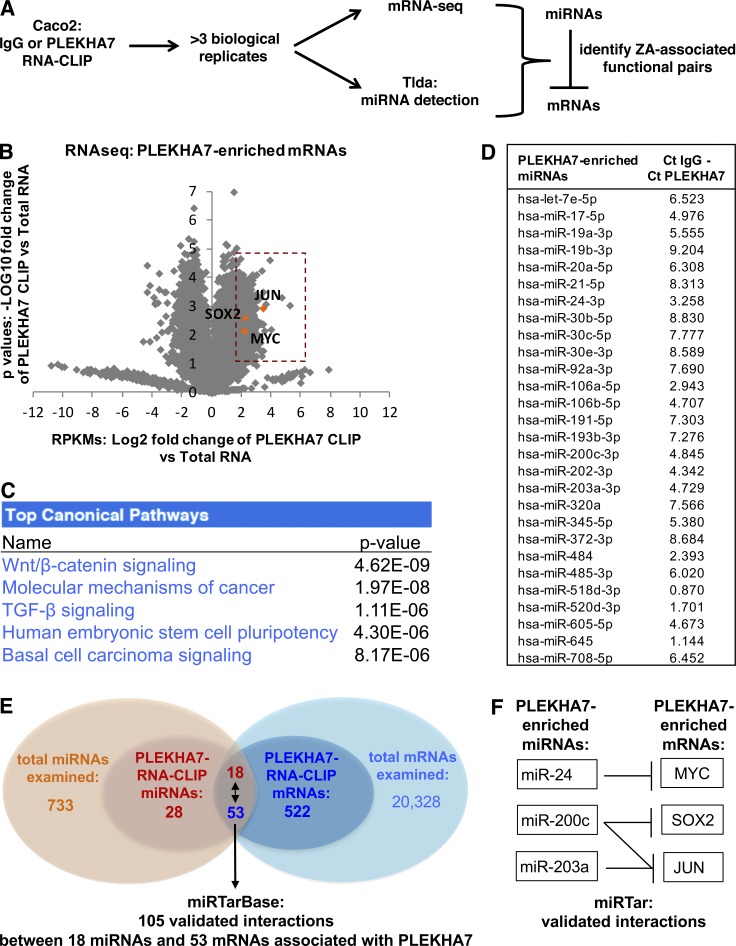
Analysis of PLEKHA7-associated RNAs reveals canonical pathways and candidate mRNAs regulated by PLEKHA7. (A) Overview of the experimental approach to identify junction-associated RNAs. (B) Volcano plot of the mRNA sequencing data, resulting from the PLEKHA7 RNA-CLIP. Only PLEKHA7-CLIP mRNAs with RPKMs that were above the IgG-CLIP RPKM background were included and compared with the total mRNA RPKMs to calculate fold enrichment (log2 values on the x axis) and p-values (n = 4 independent experiments; log10 values on the y axis). mRNAs showing fourfold enrichment (P < 0.05) in the PLEKHA7-CLIP are indicated in the orange box, highlighting JUN, SOX2, and MYC. See also Table S2. (C) Pathway analysis of the 522 PLEKHA7-enriched mRNAs, by using Ingenuity Pathway Analysis (Qiagen). The top pathways are shown. (D) RNA isolated as shown in A was subjected to TLDA. A total of 28 miRNAs exhibited Ct values in the PLEKHA7 RNA-CLIP that were above the negative control (IgG) RNA-CLIP; the mean is shown (Ct IgG/Ct PLEKHA7 column, n = 3 independent experiments). See also Table S3. (E and F) Schematics indicating the number and validated interactions (as reported in miRTar) of the PLEKHA7-enriched mRNAs and miRNAs. See also Table S4.

