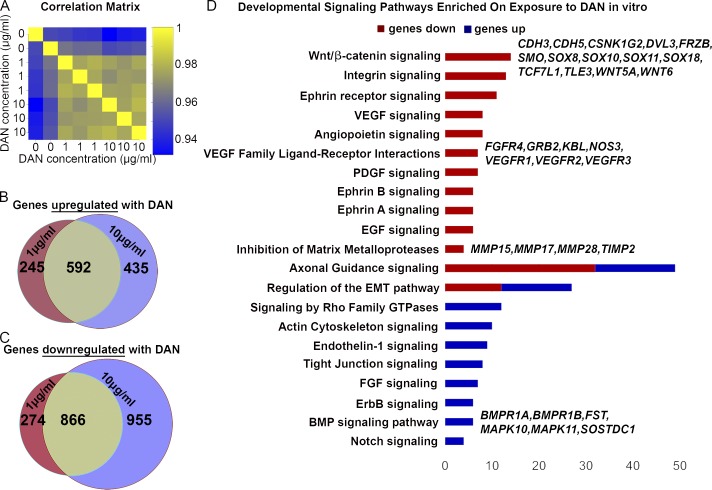
Figure 8.
DAN influences gene expression of neural crest cells. (A) Correlation matrix of the biological replicates exposed to different concentrations of DAN. (B) Venn diagram of genes up-regulated upon exposure to DAN. (C) Venn diagram of genes down-regulated upon exposure to DAN. (D) Integrated pathway analysis displaying up- and down-regulation of genes associated with developmentally relevant pathways. (E) Graph of representative guidance cues and transcription factors that are up- or down-regulated upon exposure to DAN.

