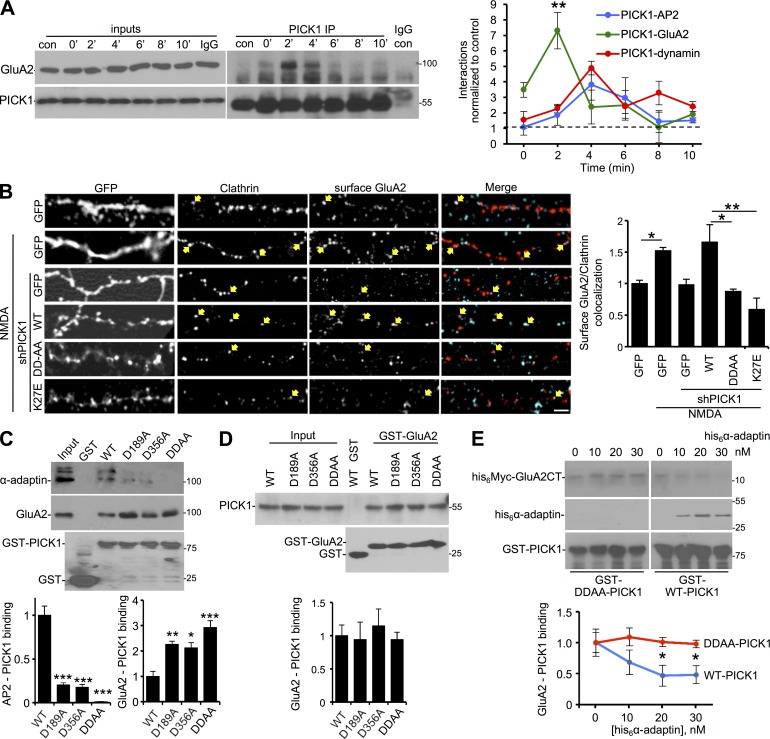
Figure 6.
PICK1 is required for clustering AMPARs at EZs via competitive binding of GluA2 and AP2. (A) NMDAR stimulation transiently increases PICK1–GluA2 binding with a different time course compared with PICK1–AP2 and PICK1–dynamin. These data were acquired from the same experiments as the AP2 and dynamin data presented in Fig. 5 (B). Graph shows quantification of PICK1–GluA2 binding (n = 6 independent experiments; **, P < 0.01; one-way ANOVA followed by Tukey’s test). (B) PICK1–GluA2 and PICK1–AP2 interactions are required for the NMDAR-dependent clustering of GluA2 at EZs. Cultured hippocampal neurons expressing dsRed-clathrin and GFP, shPICK1 + sh-resistant GFP-WT-PICK1, or mutants, as indicated, were exposed to NMDA for 3 min and then returned to normal medium for 2 min. Live cells were labeled with GluA2 antibodies before fixation. Representative confocal images are shown. Arrows indicate overlapping puncta positive for GluA2 and clathrin. Bar, 5 µm. Graph shows surface GluA2 colocalization with clathrin (Manders coefficient; n = 3 independent experiments [18–27 cells per condition in total]; *, P < 0.05; **, P < 0.01; one-way ANOVA followed by Tukey’s test). (C) DDAA mutations increase PICK1 binding to GluA2 in neuronal lysates. GST, GST-PICK1, or mutants, as indicated, were immobilized on glutathione agarose and incubated with neuronal extracts. Proteins were detected by Western blotting. Graphs show quantification of PICK1 binding to AP2 and GluA2 (n = 4 independent experiments; *, P < 0.05; **, P < 0.01; ***, P < 0.001; one-way ANOVA followed by Tukey’s test). (D) DDAA mutations have no effect on PICK1–GluA2 binding in vitro using purified components. GST or GST-GluA2 was immobilized on glutathione agarose and incubated with purified his6-PICK1 or mutants as indicated. Graph shows quantification of PICK1–GluA2 binding (n = 4 independent experiments; one-way ANOVA followed by Tukey’s test). (E) AP2 directly competes with GluA2 for binding to PICK1. GST-WT-PICK1 or GST-DDAA-PICK1 were immobilized on glutathione agarose and incubated with the 20 nM his6-Myc-GluA2 C terminus and 0–30 nM his6 α-adaptin as indicated. Graph shows quantification of GST-PICK1 binding to the his6-Myc-GluA2 C terminus (n = 6 independent experiments; *, P < 0.05; two-way ANOVA followed by Bonferroni’s correction; values are means ± SEMs).

