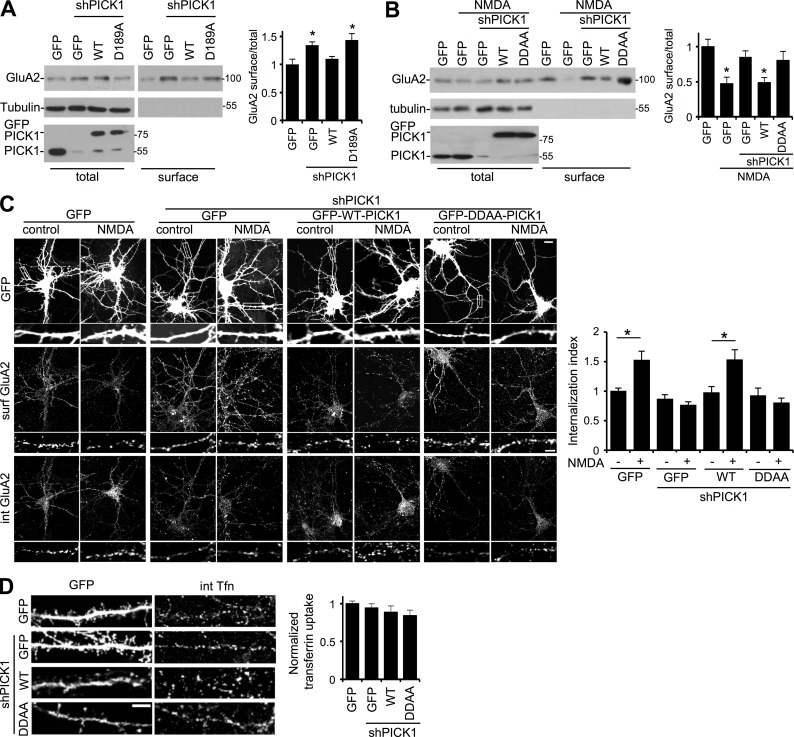
Figure 7.
PICK1–AP2 interaction is required for AMPAR endocytosis after NMDAR activation. (A) PICK1–AP2 interaction is involved in constitutive AMPAR trafficking. Neurons infected with lentivirus expressing GFP, shPICK1 + GFP, shPICK1 + sh-resistant GFP-WT-PICK1, or shPICK1 + sh-resistant GFP-D189A-PICK1 were subjected to surface biotinylation. Representative blots show surface and 5% of the total GluA2 in lysates. (B) PICK1–AP2 interaction is required for NMDA-induced reduction in surface GluA2 containing AMPARs. Neurons infected with lentivirus expressing GFP, shPICK1 + GFP, shPICK1 + sh-resistant GFP-WT-PICK1, or shPICK1 + sh-resistant GFP-DDAA-PICK1 were exposed to NMDA for 3 min, returned to normal medium for 7 min, and subjected to surface biotinylation. Representative blots show surface and 5% of the total GluA2 in lysates. (A and B) Graph shows surface/total ratio (n = 5 independent experiments; *, P < 0.05; one-way ANOVA followed by Tukey’s test; values are means ± SEMs). (C) PICK1–AP2 interaction is required for NMDA-induced endocytosis of GluA2-containing AMPARs. Hippocampal neurons transfected with GFP, shPICK1 + GFP, shPICK1 + sh-resistant GFP-WT-PICK1, or shPICK1 + sh-resistant GFP-DDAA-PICK1 were surface labeled with GluA2 antibody before application of NMDA for 3 min. 7 min later, cells were fixed and stained for the internal and surface pools of GluA2 using different secondary antibodies. Bar, 5 µm. Graph shows internalization index (internalized/total; n = 5 independent experiments [35–45 cells per condition in total]; *, P < 0.05; one-way ANOVA followed by Tukey’s test; values are means ± SEMs). (D) PICK1 is not required for the endocytosis of transferrin receptors. Hippocampal neurons transfected with GFP, shPICK1 + GFP, shPICK1 + GFP-WT-PICK1, or shPICK1 + GFP-DDAA-PICK1 were surface labeled with Alexa Fluor 568–conjugated transferrin for 12 min. After acid wash, cells were fixed and imaged. Bar, 2 µm. Graph shows quantification of internalized transferrin (n = 3 independent experiments [12–14 cells per condition in total]).

