
Figure 2.
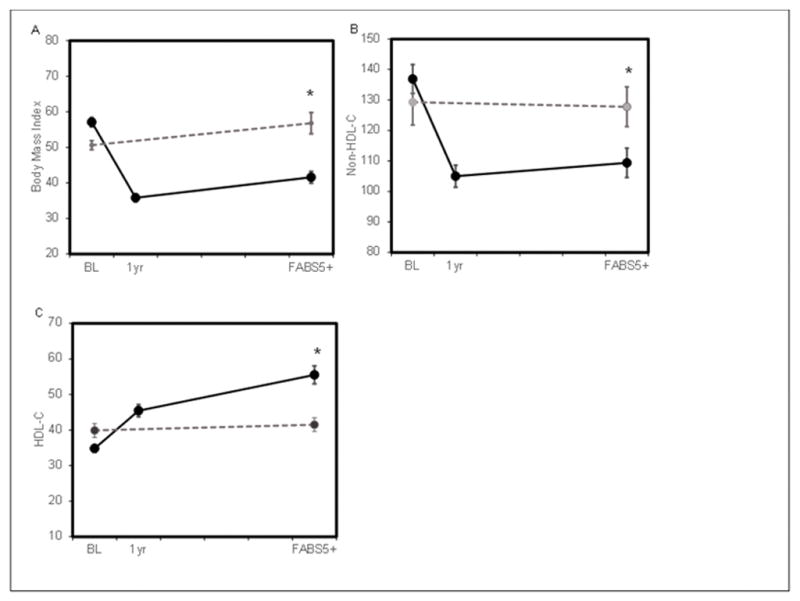
The relationship between change in lipids and BMI from 1 year postoperatively to the long-term FABS5+ visit. Solid line represents the mean and dotted lines represent the 95 percent confidence interval. Panel A shows the relationship between change in non-HDL-C (in mg/dL) and change in BMI (in kg/m2) from 1 year to long term follow-up. Panel B shows the relationship between change in HDL-C (in mg/dL) and change in BMI (in kg/m2) during the same interval.