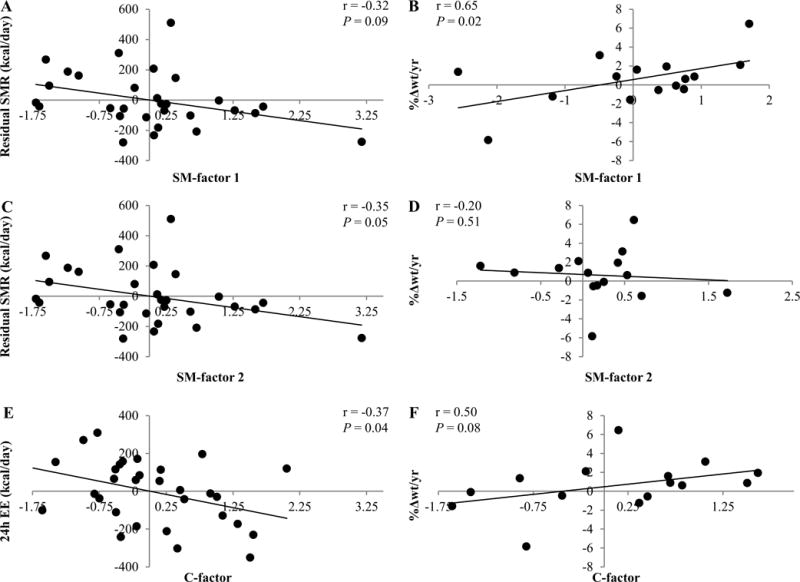
Figure 1.

Correlation of principal component analysis (PCA) factors with the residual amount of energy expenditure (EE) measurements and the relative amount of annual weight change (%Δwt/yr). Twenty-four hour EE was adjusted for age, sex, fat mass (FM), fat-free mass (FFM), and physical activity. Sleeping metabolic rate (SMR) adjustments included age, sex, FM, and FFM. Sex and age were used as covariates for %Δwt/yr. Correlations of sphingomyelin factor 1 (SM-factor 1) with the residual amount of SMR and %Δwt/yr are shown in A and B, respectively. Correlations of sphingomyelin factor 2 (SM-factor 2) with the residual amount of SMR and %Δwt/yr are shown in C and D, respectively. Correlations of ceramide factor (C-factor) with the residual amount of 24h-EE and %Δwt/yr are shown in E and F, respectively. Pearson’s correlation and P-value are reported. Sensitivity analysis excluded the study volunteer who lost approximately 6% body weight per year: This nominally affected the P-value for the association of SM-factor 1 with %Δwt/yr (r = 0.53, P = 0.08). Given the lack of association between weight change per year and initial weight (r = −0.34, P = 0.20), we performed the analysis using weight change per year (kg/yr) only, yielding similar results for principal components.
