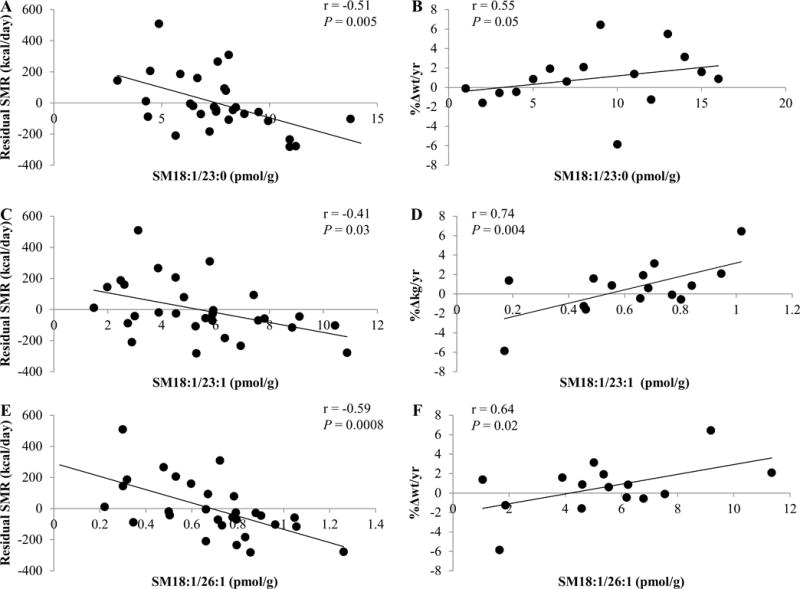
Figure 3.

Correlation of SM18:1/23:0 (A, B), SM18:1/23:1 (B, C), and SM18:1/26:1 with the residual amount of sleeping metabolic rate (SMR) after adjustment for age, sex, fat mass (FM), fat-free mass (FFM), and weight change (%Δwt/yr). Sex and age were used as covariates for %Δwt/yr. Even after excluding the study volunteer who lost approximately 6% body weight per year, SM18:1/23:0 and SM18:1/26:1 tended to correlate with the relative amount of annual weight change (%Δwt/yr, r = 0.53, P = 0.08; r = 0.53, P = 0.08, respectively). SM18:1/23:1 correlated with %Δwt/yr (r = 0.64, P = 0.02). Of note, %Δwt/yr for correlation analyses with sphingolipids was used under the assumption that a linear relationship of initial weight (kg) and weight change per year (kg/yr) exists. Exploration of this did not support this assumption in the present study cohort (r = −0.34, P = 0.20). Thus, weight change per year (kg/yr) was correlated with sphingolipid moieties. Except for SM18:1/23:0 (r = 0.37, P = 0.21), all previous associations remained significant: SM18:1/23:1, and SM18:1/26:1 correlated with kg weight change per year (r = 0.56, P = 0.05; r = 0.66, P = 0.01, respectively). Therefore, results for associations with %Δwt/yr are reported. Pearson’s correlation and P-value are reported. Abbreviation: SM, sphingomyelin.
