
Figure 4. Effects of inhibiting BTK, PI3Kδ or both on ERK and NF-κB signaling in TCL1-192 cells.
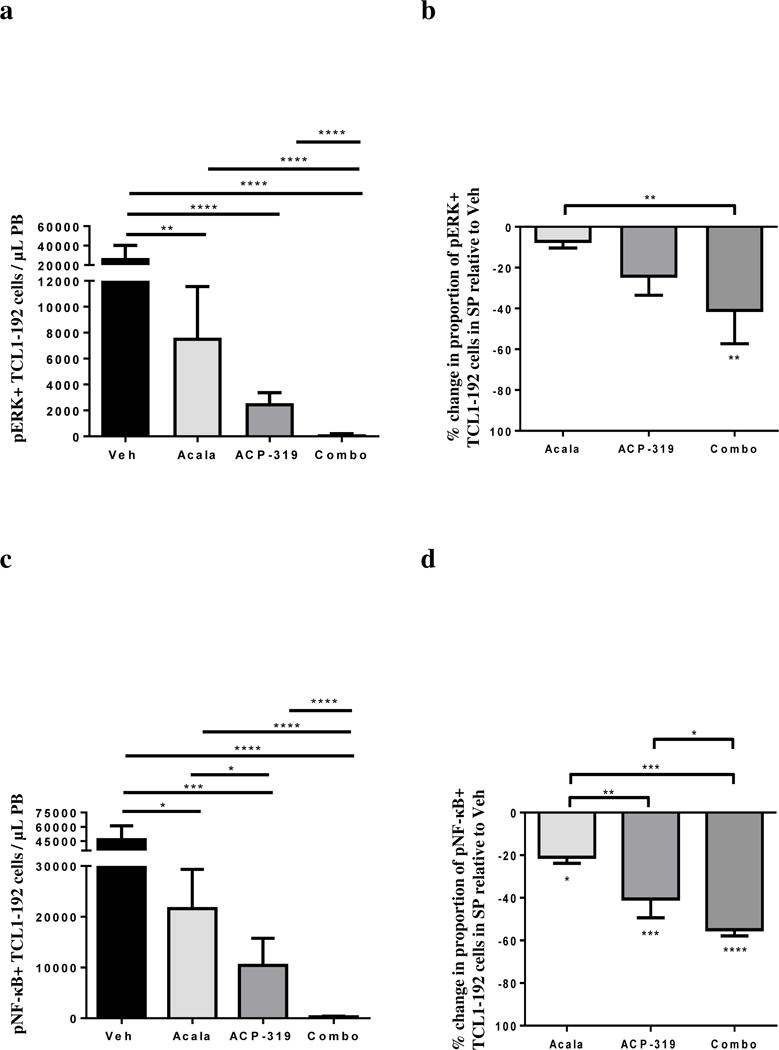
Treatment was started two weeks after TCL1-192 cell injection and mice were sacrificed four weeks after cell injection. (a) Mean ± SEM absolute numbers of pERK+ TCL1-192 cells in the peripheral blood, n=40 split evenly across treatment groups in two experimental cohorts. (b) Mean ± SEM percentage change in the proportion of pERK+ TCL1-192 cells in the spleen of mice in each treatment group compared with vehicle treated mice, n=20 split evenly across groups. (c) Mean ± SEM absolute numbers of phospho-NF-κB+ (p65) TCL1-192 cells in the PB (n=40 split evenly across treatment groups in two experimental cohorts). (d) Mean ± SEM percentage change in the proportion of phospho-NF-κB+ TCL1-192 cells in each treatment group compared with vehicle treated mice in the spleen (n=20 split evenly across treatment groups). Abbreviations: Acala, Acalabrutinib; Combo, combination treatment with acalabrutinib and ACP-319. All comparisons by an unpaired t-test using a linear model to take into account the random batch effect. Statistics comparing treatment to vehicle control are shown either above the treatment groups (panels a and c) or below the treatment bars (panels b and d); statistics comparing treatments are shown with comparison brackets: *P<0.05, **P<0.01, ***P<0.001 and ****P<0.0001.