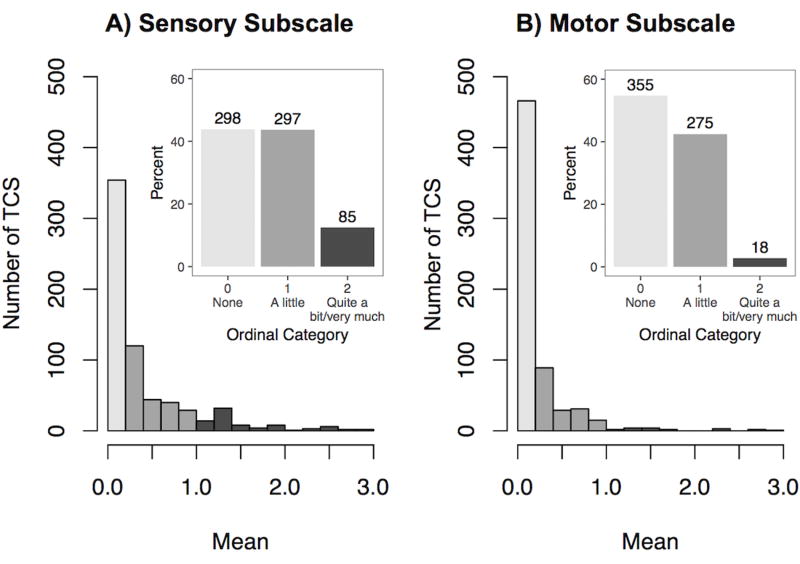
Figure 1. Distributions of summary statistics for A) the sensory subscale (eight items), and B) the motor items (eight items).
Outset: Following the conversion of the Likert “none”-“very much” scale to a 0–3 numeric scale, each individual was attributed a summary statistic for the sensory subscale (Cronbach α = 0.88) and the motor subscale (α = 0.78) by taking the mean of the responses in the subscale: none (0; mean = 0), a little (1; 0 < mean ≤ 1), quite a bit (2; 1 < mean ≤ 2), very much (3; 2 < mean ≤ 3). Inset: Percent of patients in each group (top of column lists actual number of patients) with groups 2 and 3 combined due to low frequency.

