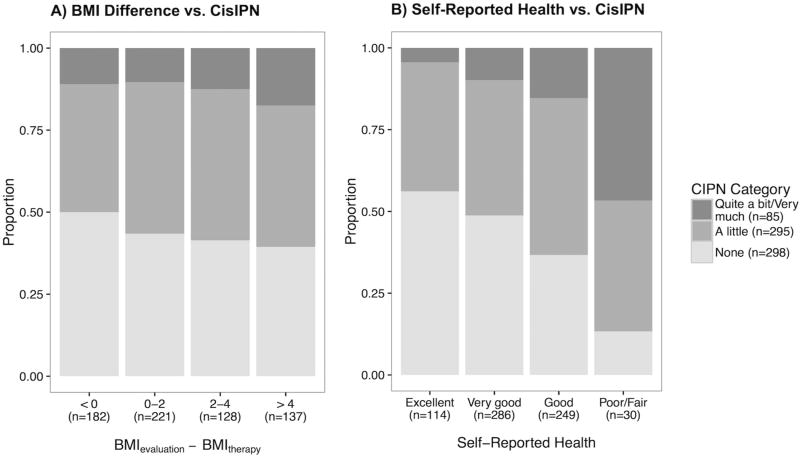
Figure 2. Relationship between weight gain and self-reported health, and severity of CisIPN.
Barplots of CisIPN vs A. Weight gain (measured as the BMI difference between evaluation and therapy) and B. Self-reported health. BMI difference positively correlated with CisIPN (OR = 1.05) after adjusting for age (p = 0.009) or number of years since treatment (p = 0.004). Self-reported health (poor-excellent) strongly negatively correlated with CisIPN (OR = 0.56, p = 2.6 × 10⁻⁹), but not with age.

