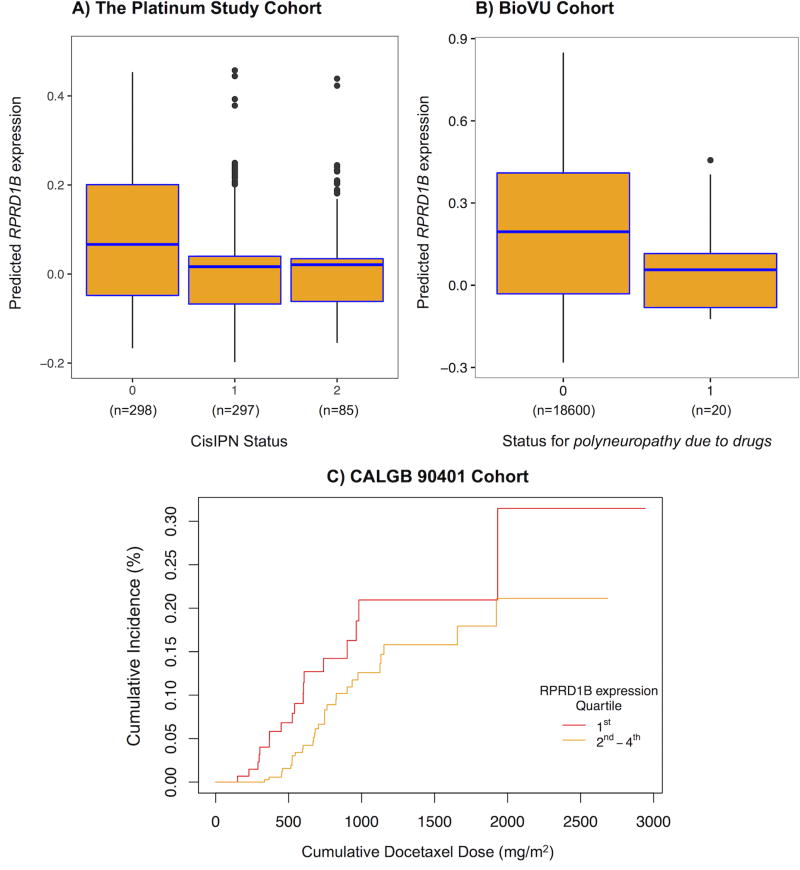
Figure 4. Association of lower RPRD1B expression and CisIPN.
Box and cumulative incidence plots of PrediXcan-predicted RPRD1B expression by neuropathy status reveal that lower expression correlates with neuropathy in A. The Platinum Study’s TCS cohort (p = 3.6 × 10⁻⁶), and B. Vanderbilt’s BioVU cohort (one tailed p = 0.021) and C. the CALGB 90401 docetaxel trial (one tailed p = 0.055). In plots A and B: The centers of the boxplots indicate means, the hinges indicate interquartile regions (IQR), the whiskers indicate points within 1.5 × IQR. Data beyond the end of the whiskers are outliers plotted as points. In plot B: Logistic regression was performed in BioVU to assess the association between PrediXcan expression and the code for polyneuropathy due to drugs – 1 for cases (n = 20), 0 for controls (n = 18,600). In plot C: Cox proportional hazards regression was performed to assess the association between PrediXcan expression and a dose-to-grade 3 or higher neuropathy event in the CALGB. An arbitrary cutoff is used to illustrate the association between the continuous gene expression variable and the dose-to-event phenotype: Individuals were ranked according to gene expression as determined by PrediXcan and the 1st quartile refers to the 25% with the lowest genetically determined RPRD1B expression and 2nd to 4th refers to the remaining individuals. Replication was assessed by Fisher’s combined p-value of both replications (BioVu and CALGB) and met significance (p = 0.0089).

