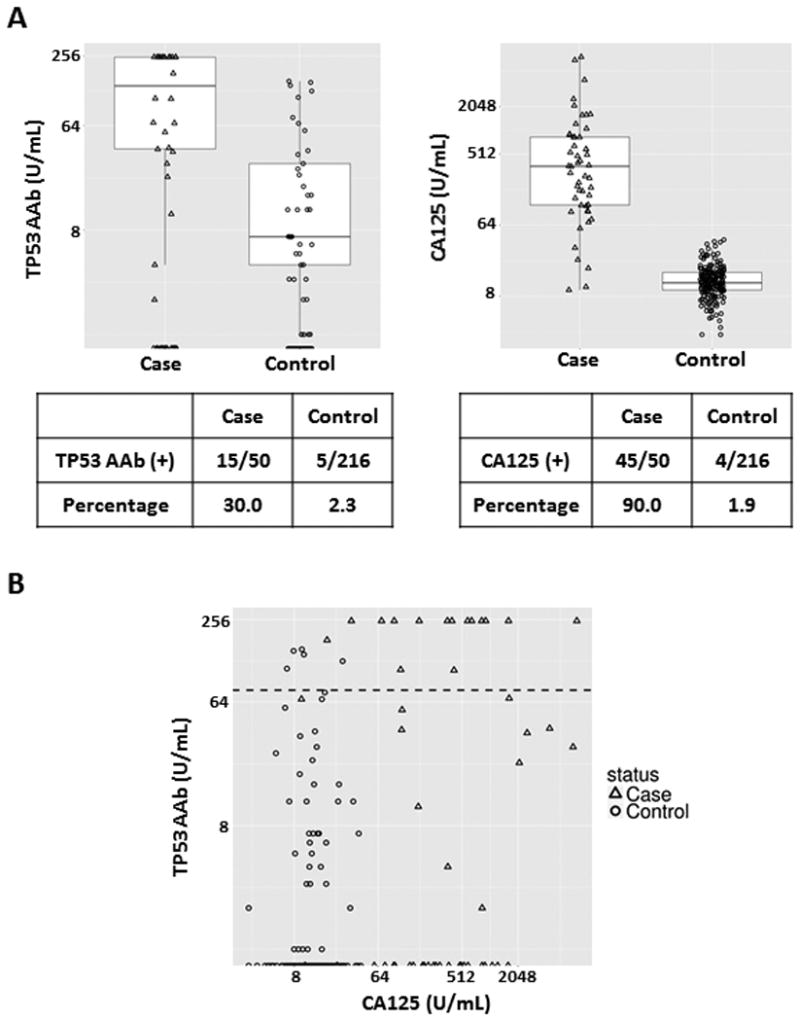
Figure 1.

TP53 autoantibody titers and CA125 values in serum samples from the MDACC-NROSS study. A, Box plots for TP53 autoantibody and CA125. Each box exhibits maximum, upper quartile, median, lower quartile and minimum values. Triangles represent cases and circles represent controls. The lower tables display TP53 autoantibody and CA125 positive numbers and percentages in the case and control groups. B, Scatter plot of TP53 autoantibody titers and CA125 values. Triangles represent ovarian cancer cases and circles represent controls. The black dashed line represents the common cut-off value (78 U/mL) of TP53 autoantibody.
