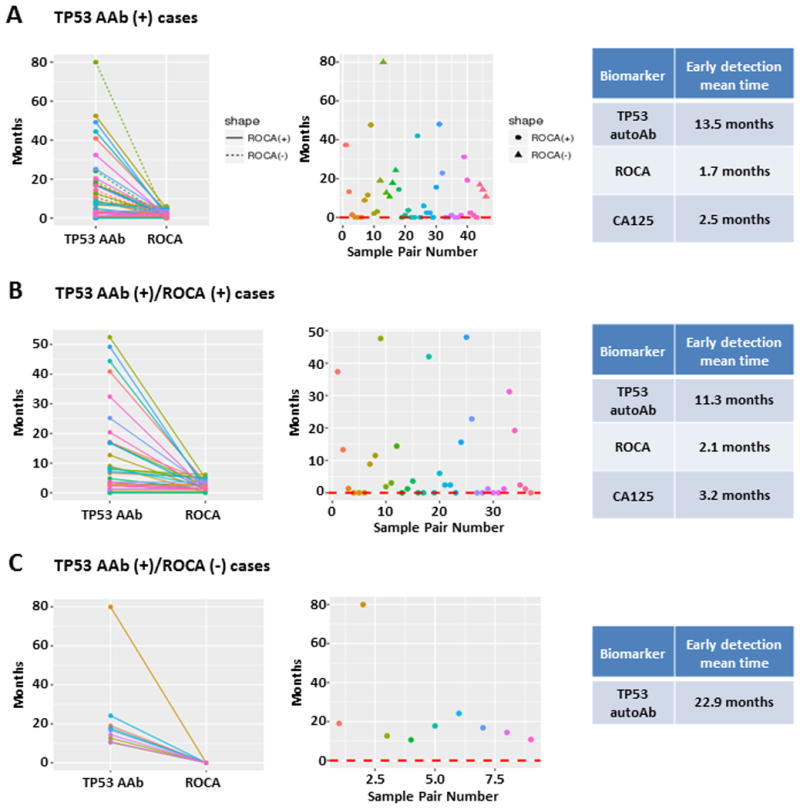
Figure 4.

Longitudinal analysis of CA125 values and TP53 autoantibody titers in pre-diagnostic serial serum samples from ovarian cancer patients in the UKCTOCS study. A, Lead time prior to diagnosis for elevated TP53 autoantibody, ROCA and CA125 (>35 U/mL) in 43 cases with elevated TP53 autoantibody. In the left panel solid lines were detected with the ROCA and the dashed lines were not. In the middle panel, circles were detected with the ROCA and the triangles were not. B, Lead time prior to diagnosis for elevated TP53 autoantibody, ROCA and CA125 (>35 U/mL) in 34 cases with elevated TP53 autoantibody who were diagnosed with the ROCA. C, Lead time prior to diagnosis for elevated TP53 autoantibody, ROCA and CA125 (>35 U/mL) in 9 cases with elevated TP53 autoantibody who were not diagnosed with the ROCA. Sample pair number indicates the index of a given sample pairing within each set, ranging from 1 to 46 in A, 1 to 37 in B, and 1 to 9 in C. Colors match between the two plots in each panel, so the dramatic downward segment in C is seen to correspond to sample pair 2, with a difference in detection times of around 80 months.
