
Figure 5.
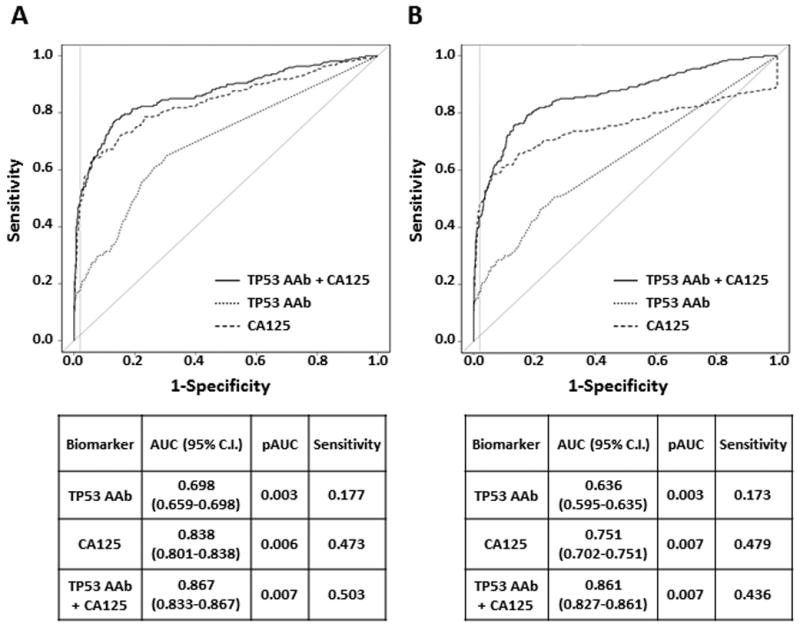
ROC curve analysis for TP53 autoantibody and CA125 biomarkers in the UKCTOCS study. A, The AUC, partial AUC (pAUC) and sensitivity for TP53 autoantibody, CA125 and the combination of these two markers are shown in the table (p value = 0.001 for AUC of CA125 vs CA125+TP53 AAb; p value = 0.097 for pAUC of CA125 vs CA125+TP53 AAb). Dotted line, ROC curve for TP53 autoantibody; dashed line, ROC curve for CA125; solid line, ROC curve for the combination of two biomarkers. The gray vertical lines are corresponding to 0.98 specificity. B, ROC curves for TP53 autoantibody and CA125 in the UKCTOCS study were calculated when 3 months was chosen as the cut-off to define the “significant early detection”. The AUC, partial AUC (pAUC) and sensitivity for TP53 autoantibody, CA125 and the combination of these two markers are shown in the table (p value = 0.000 for AUC of CA125 vs CA125+TP53 AAb; p value = 0.983 for pAUC of CA125 vs CA125+TP53 AAb).