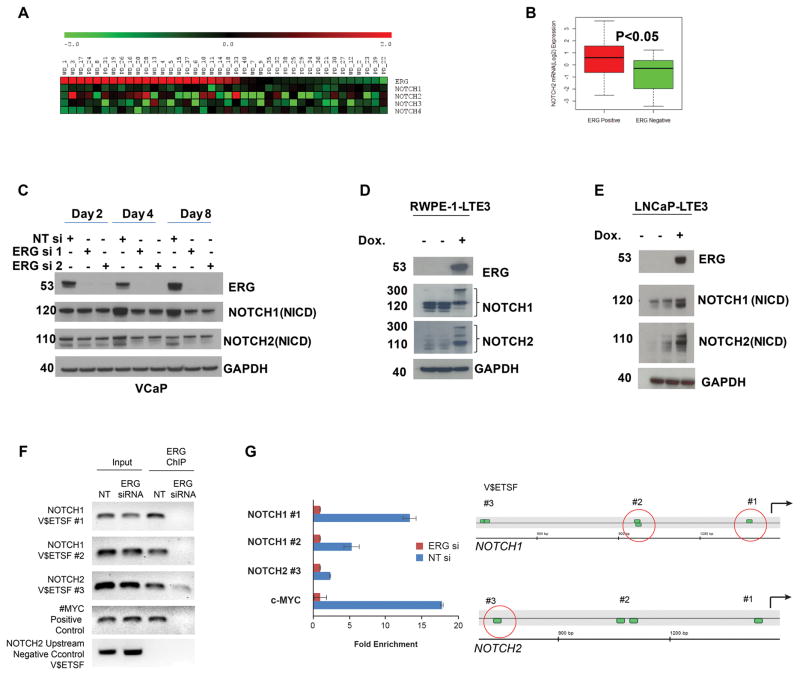
Figure 1.
NOTCH1 and NOTCH2 are transcriptionally regulated by ERG. A, Association of NOTCH factors with ERG expression status. Association of ERG and NOTCH expression were evaluated in a cohort of well (WD) and poorly differentiated (PD) CaP samples. B, Among the four NOTCH transcription factors, NOTCH2 showed significant association with ERG status. C, Decreases protein levels NOTCH1 and 2 (NICD: NOTCH intracellular domain) in response to knockdown of ERG in VCaP cells. D&E, Heterologous expression of TMPRSS2:ERG3 (ERG) under the control of stable integrant doxycycline (Dox) inducible promoter resulted in increased protein levels of NOTCH1 and 2 in LNCaP (LNCaP-LTE3) cell line or in benign prostate derived immortalized prostate epithelial cells (RWPE-1). F, ERG is recruited to predicted ERG binding sites of NOTCH1 (NOTCH1_V$ETSF#1, NOTCH1_V$ETSF#2) and NOTCH2 (NOTCH2_V$ETSF#3) gene promoter upstream sequences which was diminished in response to ERG siRNA treatment. The recruitment of ERG to the C-MYC promoter (37) was used as a positive and a distal upstream sequence within 15 kb of the NOTCH2 transcription initiation site lacking ETS motifs was as negative control. Input DNA was used as technical control. In quantitative ChIP PCR the fold enrichment was calculated as the ratio of input normalized fold changes between NTsi (2^ dCT) and ERGsi (2^ dCT) values (48). G, Position of predicted ERG binding sites (V$ETSF) relative to the 5′ end of evaluated NOTCH1 and NOTCH2 gene promoter upstream sequences. Red circles indicate position of detected ERG recruitment.

