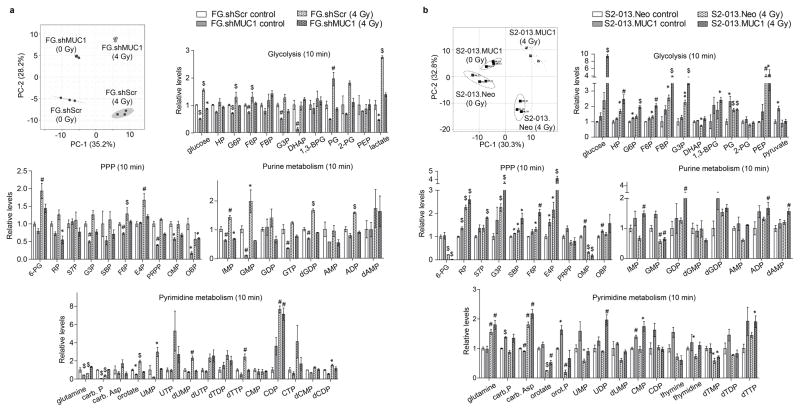
Figure 3. MUC1 facilitates radiation-induced carbon flux into glycolysis and de novo nucleotide biosynthesis pathways.
Partial least squares discriminant analysis (PLS-DA) plots in panels a and b represent differential clustering of control and irradiated cells based on their total polar metabolite content. Each filled circle/square indicates an individual sample. The three closely clustered circles or squares represent three biological replicates of an individual group of samples extracted from one cell line. The axes of the PLS-DA plots represent principal component-1 (PC-1) and -2 (PC-2), which indicate the variance among the groups. PLS-DA analyses were performed utilizing Metaboanalyst algorithm with mean intensities and pareto scaling distribution. Bar charts in a and b show fold change in metabolite levels of glycolysis, pentose phosphate pathway (PPP), and purine and pyrimidine metabolic pathways upon irradiation in experimental cells compared to their respective wild-type cells. Bars represent mean ± SEM of three biological replicate values; *, # and $-indicate p<0.05, p<0.01, and p<0.001, respectively, obtained through one-way ANOVA and Benjamini-Hochberg’s procedure to control the false discovery rate.

