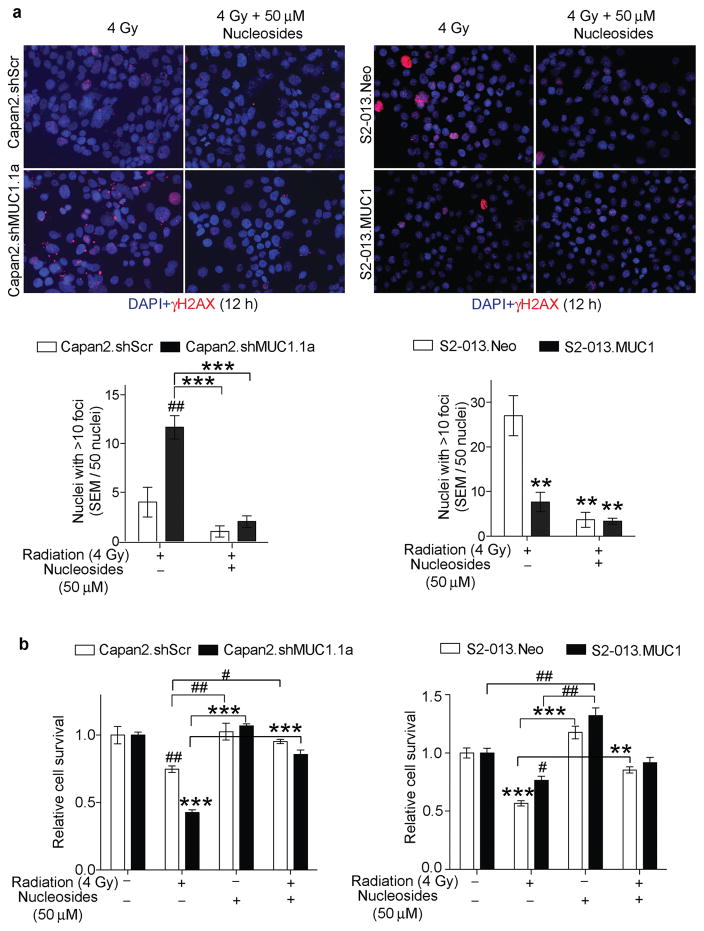
Figure 4. MUC1 facilitates radiation resistance through nucleoside-mediated DNA damage repair.
(a) Representative immunofluorescence images indicating γH2AX staining (red) as a measure of DNA damage upon irradiation and treatment with nucleosides for 12 h. DAPI staining (blue) indicates nuclei. Fluorescence images represent representative fields of respective treatments captured at 20X magnification. Bar charts indicate quantification of the number of nuclei with >10 foci from a total of 50 nuclei considered for each condition. (b) Bar charts show relative cell survival under radiation and/or nucleoside supplementation. All bars represent mean ± SEM of three biological replicates. */#, **/##, and ***/### indicate p<0.05, p<0.01, and p<0.001, respectively, obtained through one-way ANOVA with Tukey’s multiple comparison test. *, **, and *** indicate statistical significance in comparison to wild type or MUC1-kd cells, whereas, #, ##, and ### indicate statistical significance with respect to the MUC1-expressing cells.

