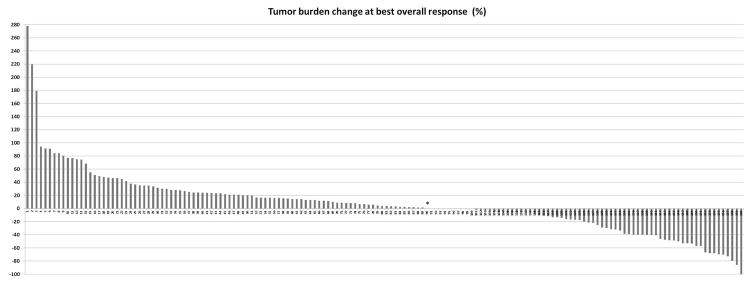
Fig. 1. Waterfall plot of tumor burden change relative to baseline at irBOR.
One patient indicated by asterisk (*) experienced their irBOR after initial tumor increase (pseudoprogression). Although one patient achieved a 100% decrease in target lesions, this was categorized as a partial response because non-target lesions did not disappear completely.

