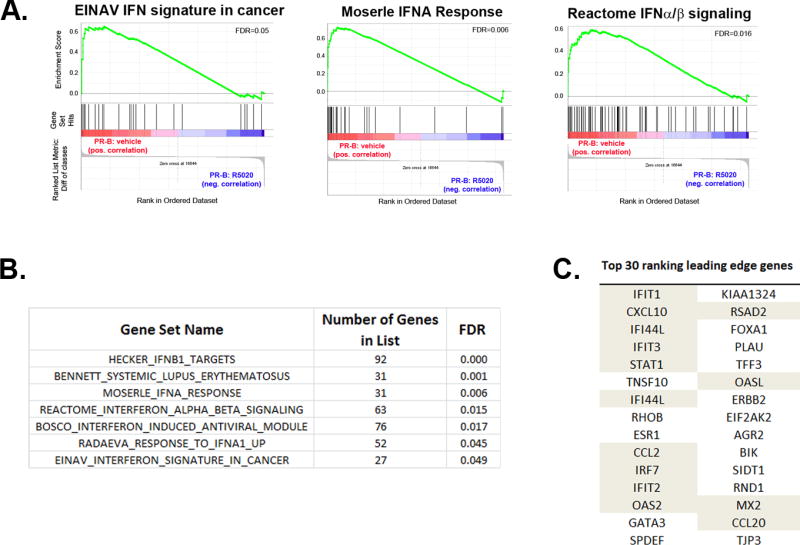
Figure 1. Interferon signaling enriched in PR data set.

(A). GSEA comparing gene expression datasets obtained using the Illumina Microarray data set published in Hagan et al, 2013. Vehicle vs R5020 (synthetic PR ligand) are compared in T47D cells stably expressing full length PR. Select gene sets are shown from the C2 MSigDB. (B). Summary of interferon-related gene sets that are included in the most significant (FDR < 0.05; 54 gene sets in total) gene sets from MSigDB C2 GSEA analysis. (C). Top 30 ranking genes as identified using Leading Edge (LE) analysis on 54 gene sets referred to in (B). Shading denotes genes that are interferon-signaling related and/or interferon-stimulated genes (ISGs).
