
Figure 5. Interferon-activated ISG expression is repressed by ligand-activated PR.
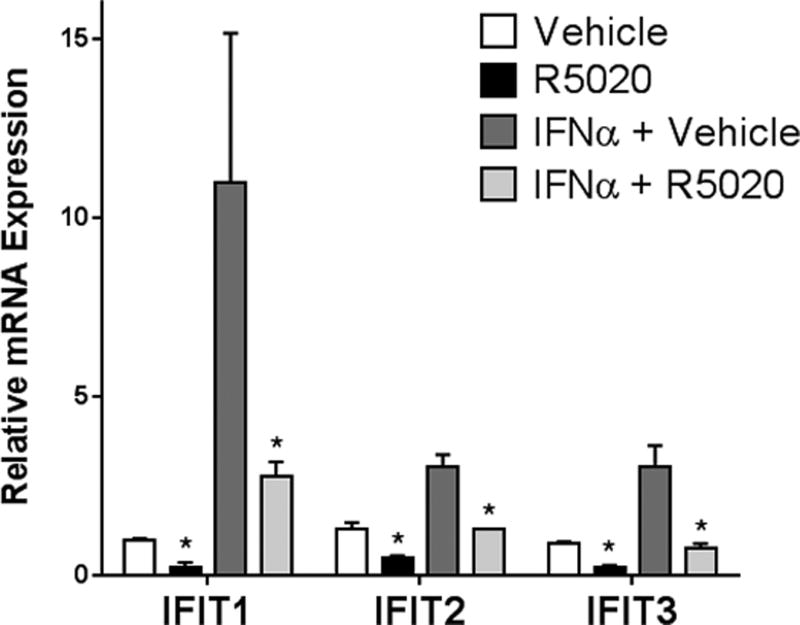
Following an 18hr starvation in serum-free media, cells were treated for 18hr with IFNα (20 IU/ml) or vehicle (water) for 18hr, followed by R5020 (10nM) or vehicle (EtOH) for 6hr. Isolated RNA was analyzed for expression of IFIT1, IFIT2, and IFIT3. Gene expression values were normalized to an internal control (β-actin). Error bars represent SD between biological triplicates. Asterisks represent statistical significance between the respective vehicle and R5020-treated groups; p < 0.05, as determined using an unpaired Student’s t-test. This experiment was performed in triplicate, and a representative experiment is shown here.