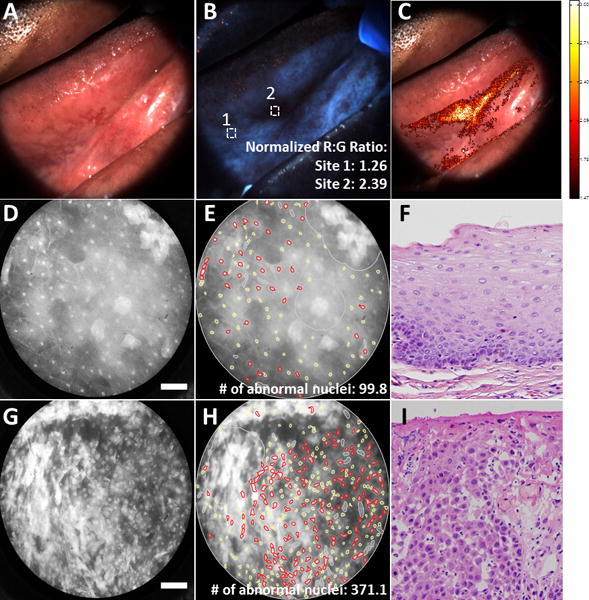
Figure 1.

Multi-modal images from a patient with a clinically suspicious lesion at the right lateral tongue. Top row shows the white light reflectance image (A), autofluorescence image (B), and normalized R:G ratio overlay (C). White squares in (B) denote regions of interest corresponding to biopsy site locations. Middle row shows the raw HRME (D), processed HRME image (E) and corresponding histology image (F) for biopsy site 1. Bottom row shows the raw HRME image (G), processed HRME image (H), and corresponding histology (I) for biopsy site 2. Histology images taken at 20× magnification. Scale bar denotes 100 μm. R:G: Red:Green. HRME: High-resolution microendoscope.
