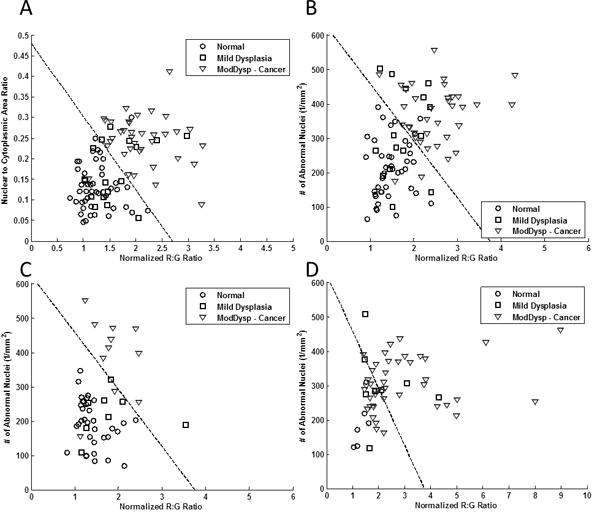
Figure 2.

Diagnostic algorithm based on multi-modal imaging parameters for (A) training set using manual image analysis as reported by Pierce et al. (B) training set using automated image analysis, (C) test set using automated analysis of biopsied sites, and (D) test set using automated analysis of surgical specimens. Dashed lines represent linear threshold values to discriminate neoplastic and non-neoplastic sites. Data from two correctly classified neoplastic sites in (C) were omitted from view due to scaling of the x-axis.
