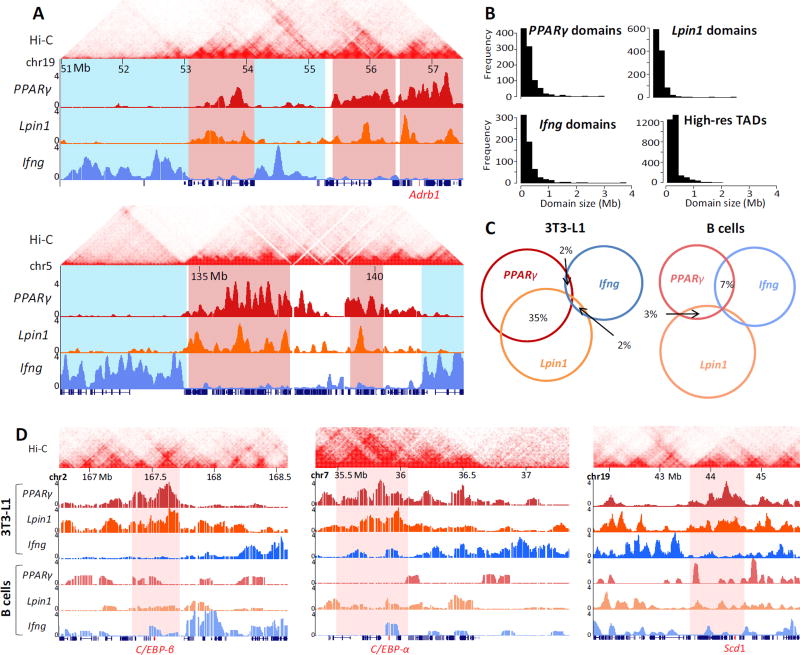
Fig. 1. Adipocyte-specific genome architecture.
(A) Examples of 4C-seq inter-chromosomal association profiles in 3T3-L1 preadipocytes showing contact domains shared by PPARγ and Lpin1 (highlighted in red), while distinct from Ifng chromosomal contacts (highlighted in blue). Adrb1 adipogenic gene is highlighted in red on the x-axis. Y-axis indicates p-score. Local intra-chromosomal contact domains (TADs) from Hi-C in murine CH12-LX cells are shown on top [33]. (B) Histograms of domain sizes from high resolution mouse CH12-LX TADs [33], PPARγ, Lpin1 and Ifng 4C domains. (C) Venn diagram showing overlap (in base pairs) of the inter-chromosomal interactomes in 3T3-L1 and B lymphocytes. The lowest overlap in 3T3-L1 is between Ifng and the adipogenic genes PPARγ and Lpin1. (D) Examples of 4C-seq inter-chromosomal association profiles in 3T3-L1 and B lymphocytes at C/EBP-β, C/EBP-α and Scd1 adipogenic gene loci (highlighted in red). Y axis indicates p-score. Chromosomal coordinates in Mb of mouse mm9 genome build are indicated on top.

