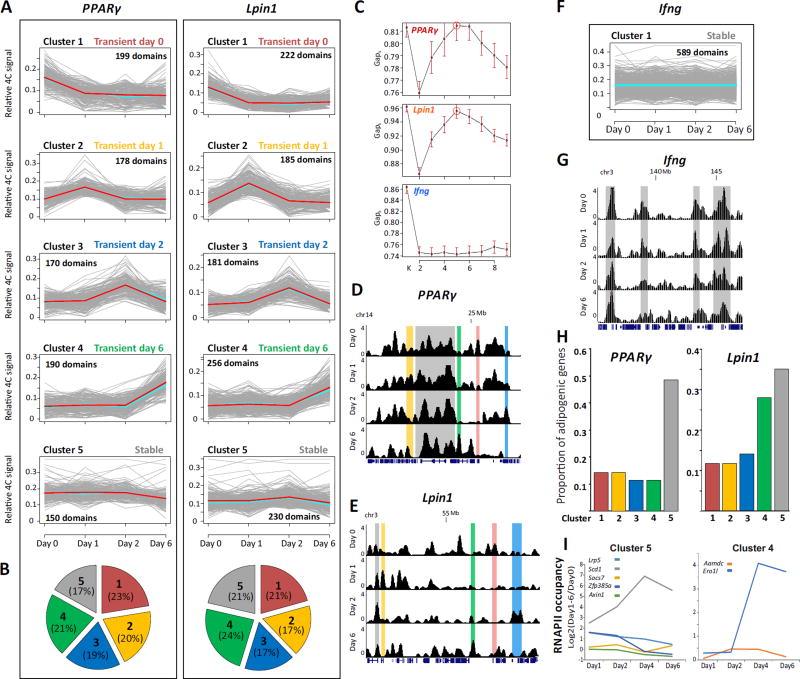
Fig. 4. Common chromosomal reorganization dynamics at adipogenic gene loci.
(A) Cluster analysis of PPARγ and Lpin1 contact regions identified by 4C-seq reveal distinct temporal profiles of chromosomal associations. Each cluster is presented in a plot where the X axis indicates the time points in the differentiation. Y axis represents relative 4C signal. Grey lines represent contact domains, light-blue and red lines represent the mean and the medoid, respectively. (B) Pie chart representing the proportion of contact regions in each cluster for each bait. (C) The number of clusters (1 to 9) and the statistical ratio (Gapk) calculated for each 4C dataset showing that for both PPARγ and Lpin1, the best K is 5 (indicated by a circle). For Ifng no such K is obtained. Red bars indicates SE, n=60. Representative examples of 4C regions in each cluster of PPARγ (D) and Lpin1 (E) are highlighted in screen shots from the UCSC Genome Browser. (F, G) Cluster analysis and example of contacts for Ifng 4C. Y-axis indicates p score. Chromosomal coordinates in Mb of mouse mm9 genome build are indicated. (H) The proportion of adipogenic genes in each dynamic cluster from the total of adipogenic genes in the chromosomal interactome of PPARγ (left) and Lpin1 (right). (I) Transcription dynamics (log2 ratios of RNAPII occupancy at each day relative to day 0) of adipogenic genes in cluster 5 (left) and cluster 4 (right), of both PPARγ and Lpin1.

