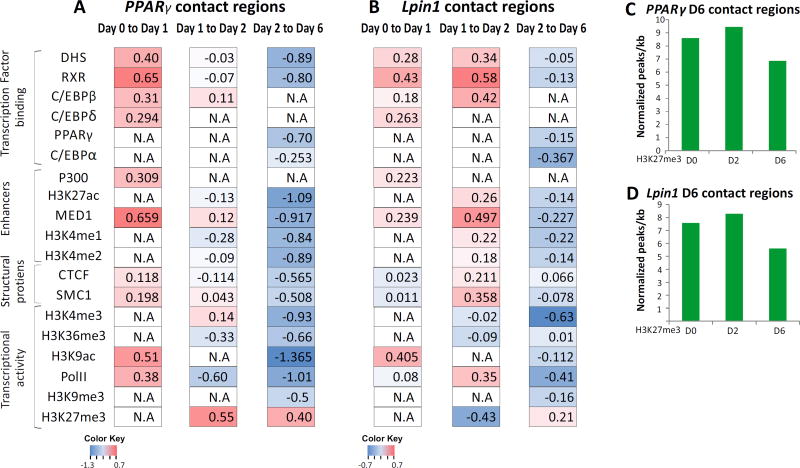
Fig. 5. Concordant dynamics of genome high-order reorganization and chromatin structure.
The relative enrichment of transcription factors, CTCF, RNA-PolII and histone marks at each transition point during adipogenesis. Enrichment was calculated as the ratio between ChIP-seq signal on the contacts joined relative to the contact domains that disjointed from PPARγ (A) and Lpin1 (B) in each transition. The ratios are presented on a log2 scale. (N.A - ChIP data for a particular day is not available). Normalized H3K27me3 peaks (peaks per kb per total peaks *1000) through the differentiation at the chromosomal contacts of PPARγ (C) and Lpin1 (D) in mature adipocytes (day 6).

