
Figure 3. Gastric cancer phenotype in double conditional mice with one copy of E-cadherin (Atp4b-Cre;Rosa26LSL-YFP;Cdh1fl/+,Trp53fl/fl;KrasLSLG12D/+ or Dcon-Ecad het mice).
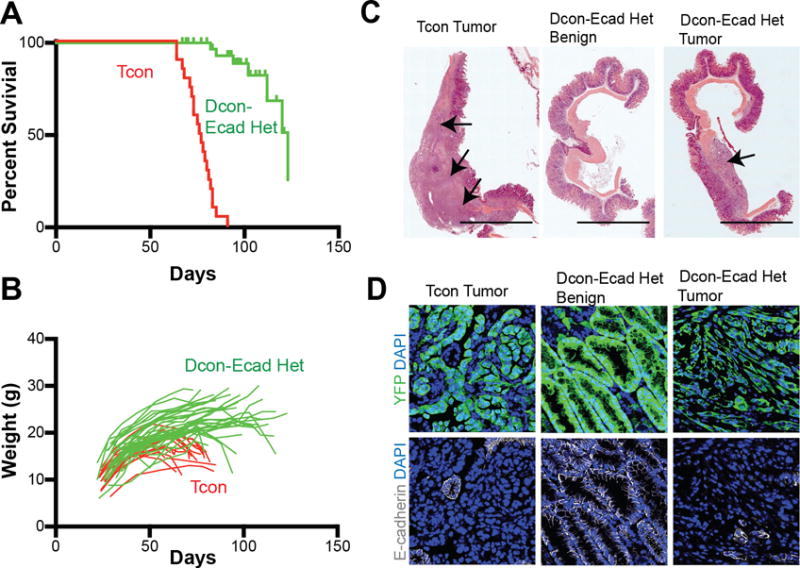
(A) Survival curve demonstrating 123 day median survival (n=27) of Dcon-Ecad het mice (green) compared to 76 day median survival (n=20) of Tcon (red) mice. (B) Graph representing the weights of individual mice in survival analysis over time. (C) Representative gross image of a Tcon stomach (80 days of age, scale bar: 1 cm) as compared to stomachs from Dcon-E-cad het mice without a tumor (77 days of age, benign) or a stomach with a tumor (108 days of age, tumor). Arrows denote tumors. (D) Representative immunofluorescence images of YFP (green) and E-cadherin (white) expression with DAPI (blue) in stomachs isolated from mice with the indicated genotypes.