
Figure 4. Increased KRAS signaling in gastric tumors from Tcon mice.
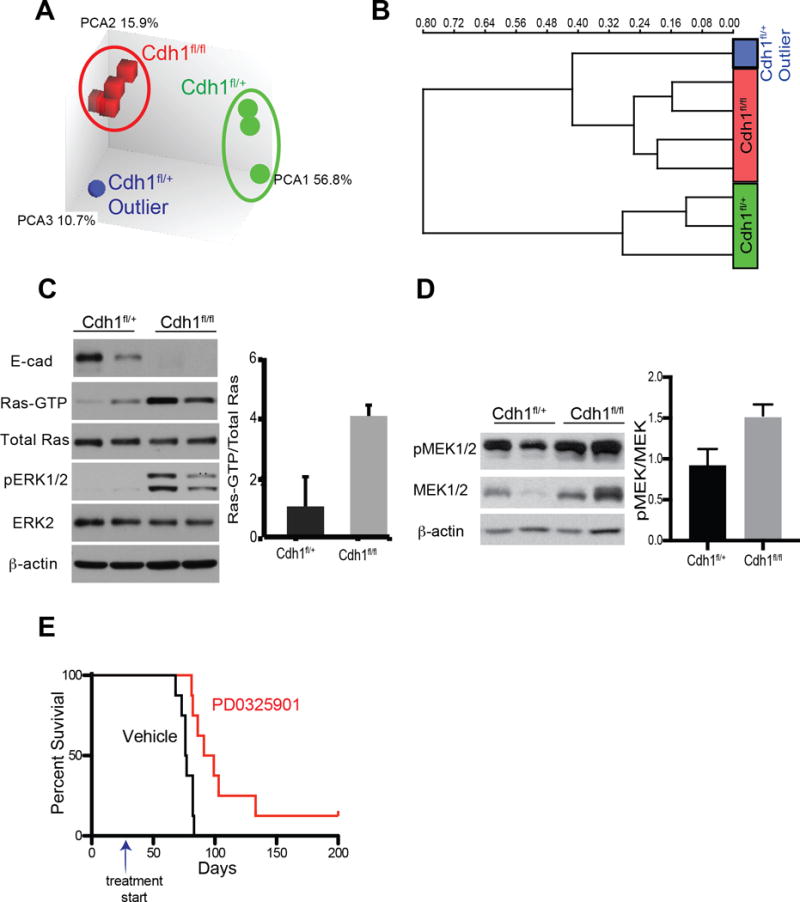
(A) Principal component analysis (PCA) and (B) unsupervised hierarchical clustering analysis of microarray data from Tcon (Cdh1fl/fl) and Dcon-Ecad heterozygous (het) stomachs (Cdh1fl/+). (C) Western blot analysis of RAS-GTP pulldown, total RAS, phopho-ERK, total ERK and β-actin in gastric cancer cell lines isolated from Tcon (Cdh1fl/fl) gastric tumors and from Dcon-Ecad het (Cdh1fl/+) tumors. Each lane is an independent gastric cancer cell line. Densitometric quantification of RAS-GTP relative to total RAS is shown on the right. (D) Western blot analysis of phospho-MEK and total MEK expression in stomach lysates from Tcon and Dcon-Ecad het (Cdh1fl/+) mice. Densitometric quantification of phospho-MEK levels relative to total MEK shown on the right. (E) Survival curve of Tcon mice treated with the MEK inhibitor PD0325901 or vehicle beginning at 4 weeks of age (indicated by arrow) demonstrating an increase in median survival of 96 days in the presence of the MEK inhibitor over vehicle (p=0.001, n=8).