
Figure 5. Increased β-catenin activation in gastric tumors from Tcon mice.
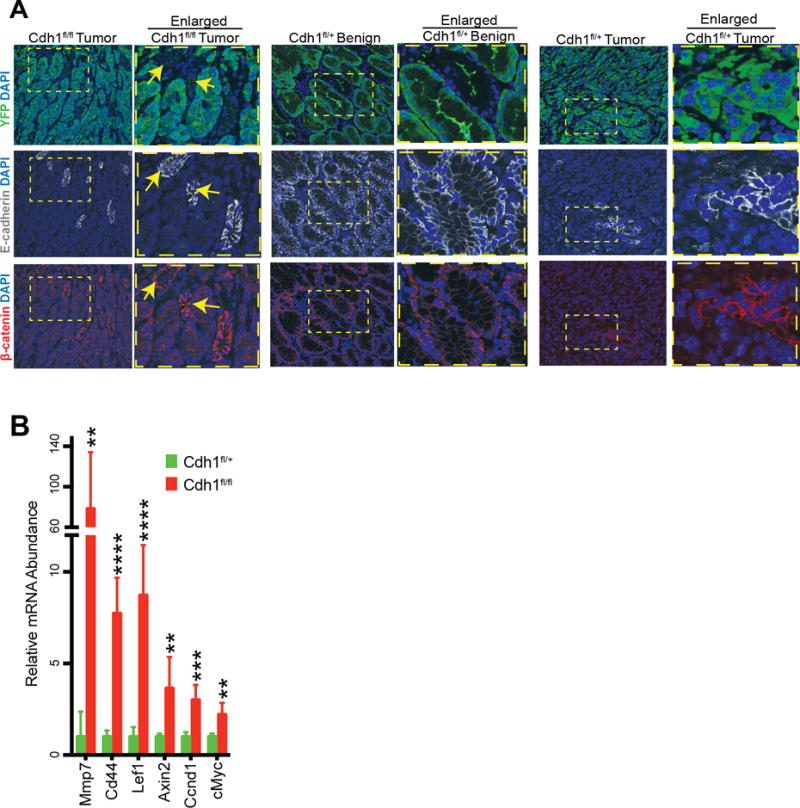
(A) Representative immunofluorescence images of YFP (green), E-cadherin (white), and β-catenin (red) expression with DAPI (blue) in stomachs isolated from mice with the indicated genotypes. Dotted yellow boxes indicate enlarged insets and arrows indicate non-tumor YFP- areas. (B) Expression of canonical β-catenin target genes in Tcon vs. Dcon-Ecad heterozygous (het) stomachs. Data are normalized to HPRT expression and displayed as mean fold change over Dcon-Ecad het stomachs + standard deviation (n=6).