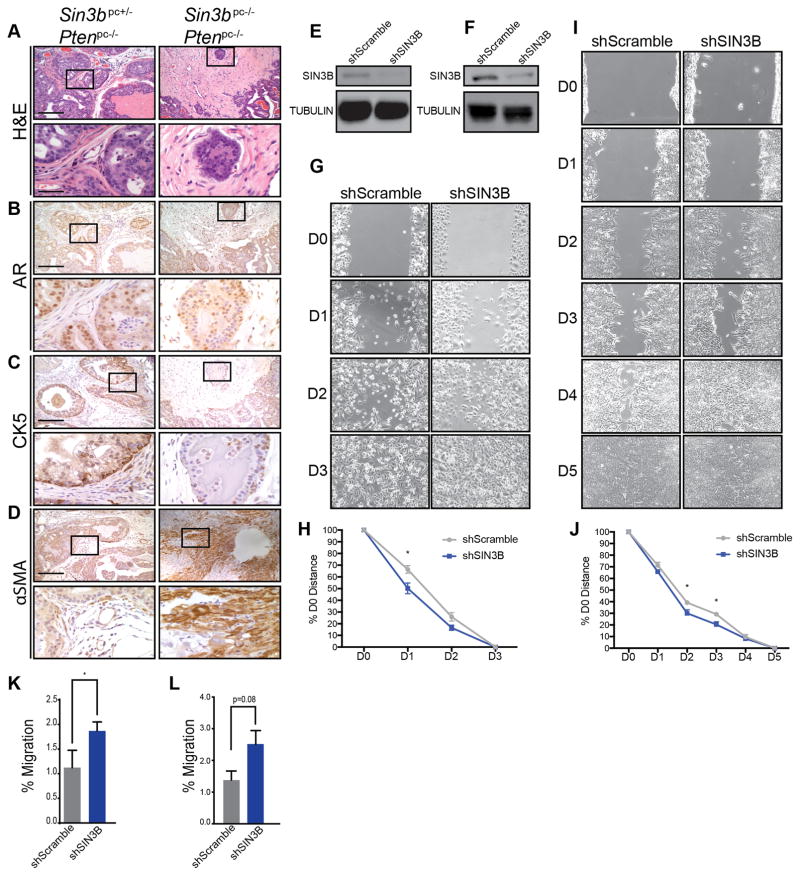
Figure 4.
SIN3B protects against aggressive PCa. A, Representative images of H&E staining on paraffin sections of the dorsolateral lobe of prostates taken from 12-month-old Sin3bpc+/− Ptenpc−/− (n = 8) and Sin3bpc−/− Ptenpc−/− (n = 7) mice. B, Immunohistochemistry for AR on serial paraffin sections of the dorsolateral lobe of prostates taken from twelve-month-old Sin3bpc+/− Ptenpc−/− mice (n = 3) and Sin3bpc−/− Ptenpc−/− (n = 3) mice. C, Immunohistochemistry for CK5 on serial paraffin sections of the dorsolateral lobe of prostates taken from twelve-month-old Sin3bpc+/− Ptenpc−/− (n = 3) and Sin3bpc−/− Ptenpc−/− (n = 3) mice. Top Panel = 10× magnification. Bottom Panel = 40× magnification. Scale bar = 200 μm. D, Immunohistochemistry for αSMA on paraffin sections of the dorsolateral lobe of prostates taken from twelve-month-old Sin3bpc+/− Ptenpc−/− (n = 3) and Sin3bpc−/− Ptenpc−/− (n = 3) mice. Top Panel = 10× magnification. Bottom Panel = 40× magnification. Scale bar = 200 μm. E, Immunoblot analysis for SIN3B and TUBULIN using 40 μg of whole cell extracts from PC3 cells stably transduced with either shRNA against Scramble or SIN3B. F, Immunoblot analysis for SIN3B and TUBULIN using 40 μg of whole cell extracts from LNCaP C4-2 cells stably transduced with either shRNA against Scramble or SIN3B. G, Scratch assay using cells lines in E. D0–3 represent days post scratch. H, Quantification of G. n=3, student’s t-test was used to assess significance at each time point. * p<0.05. I, Scratch assay using cells lines in F. D0–5 represent days post scratch. J, Quantification of I. n=3, student’s t-test was used to assess significance at each time point. * p<0.05. K, Transwell migration assay using cell lines in E. Average±SEM of n = 3 experiments. Student’s t-test was used to assess significance. * p<0.05. L, Transwell migration assay using cell lines in F. Average±SEM of n = 3 experiments. Student’s t-test was used to assess significance. P=0.08, NS.

