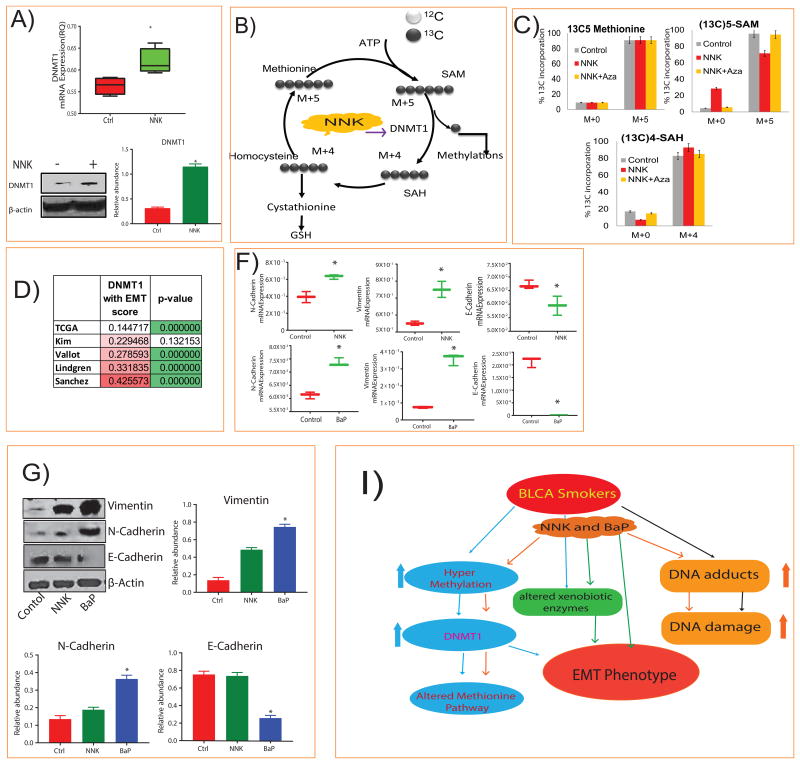
Figure 4. NNK induced DNMT1 expression, methionine flux and Epithelial-Mesenchymal Transition (EMT) markers.
A) Box plots showing mRNA and protein expression of DNMT1, in untreated and treated J82 cells with NNK (p<0.005) and their quantification. B) The role of DNMT1 in methionine pathway. C) Isotopic distributions of 13C labeled methionine pathway metabolites showing down regulation of SAM and upregulation of SAH upon treatment with NNK and reverse with NNK followed by AZA in J82 cells. D) Correlation of DNMT1 expression with EMT scores from multiple public cohorts. F, G) mRNA and protein expression of N-cadherin, E-Cadherin and vimentin in J82 cells treated with NNK and BaP (p <0.005) and their quantification. β-actin was used as the loading control. I) Working model showing the alterations in BLCA associated with smoking.

