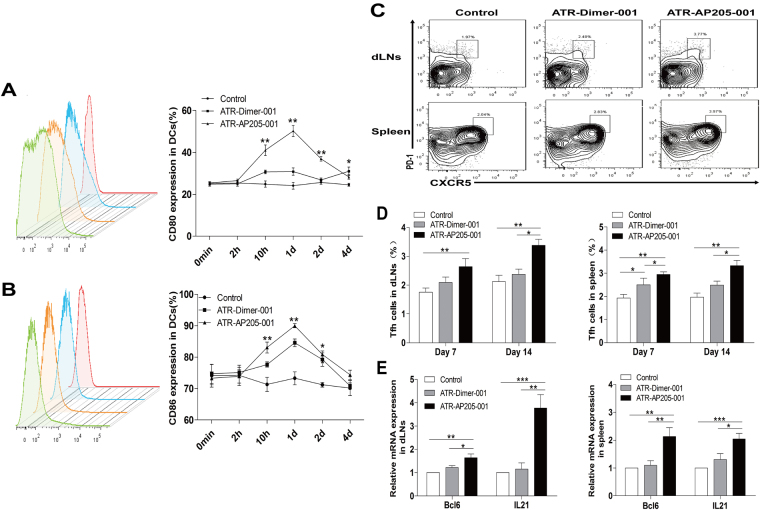
Figure 4.
Tfh cells enhancement after ATR-AP205-001 vaccination. The expression of co-stimulatory molecules CD80 (A) and CD86 (B) on DCs at 0 min, 2 hrs, 10 hrs, 1 day, 2 days and 4 days post vaccination (n = 6 per group). (C) PD-1highCXCR5high Tfh cells, gated on CD4+ T cells. (D) Proportion of Tfh cells in dLNs and spleen on days 7 and 14 (n = 7–9 per group). (E) Relative mRNA expression of Bcl-6 and IL21 in dLNs and spleen on day 14 (n = 7–9 per group). Data are presented as mean ± SEM. *P < 0.05, **P < 0.01, ***P < 0.001.

