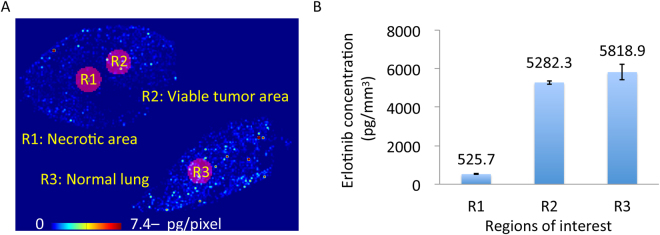
Figure 3.
Comparison of relative erlotinib concentrations among necrotic, viable tumor, and normal lung regions in the mouse xenograft model (A) Erlotinib tissue distribution by matrix-assisted laser desorption/ionization mass spectrometry imaging and regions of interest are shown. (B) Relative erlotinib concentrations were estimated from the mass spectrometry images and liquid chromatography-tandem mass spectrometry using serial sections, and were compared among necrotic, viable tumor, and normal mouse lung regions in the mouse xenograft model. Error bar = standard deviation of replicate analysis for each region of interest.

