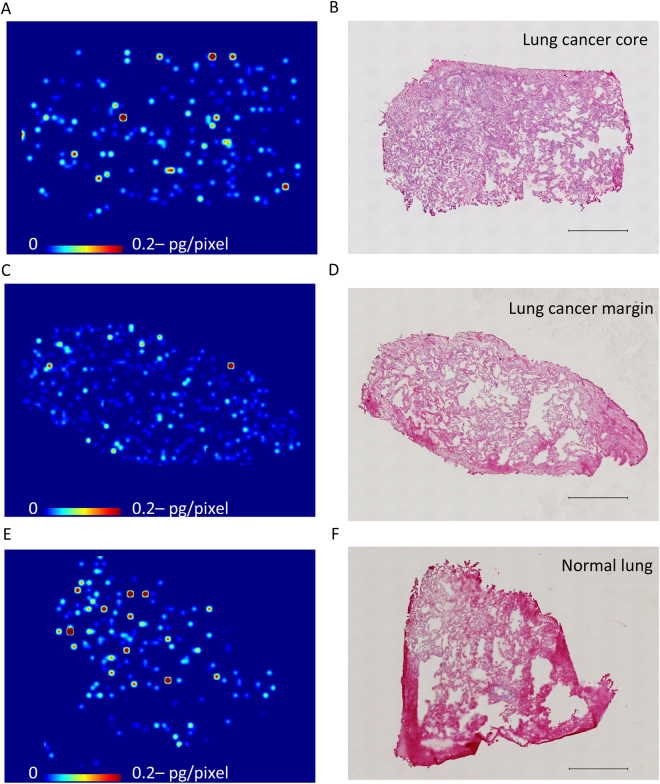
Figure 4.
Erlotinib tissue distribution in lung cancer with the epidermal growth factor receptor L858R mutation (A,C,E) Molecular images of heterogeneous erlotinib distribution at 6 h after single administration of 150 mg in the lung cancer core, marginal region, and normal lung tissues, respectively. Scale bar indicates erlotinib quantity per pixel, and upper limit of the scale bar indicates more than 0.2 pg/pixel erlotinib. Molecular images were acquired at a step size of 60 μm. (B,D,F). Hematoxylin and eosin staining of the sections after acquiring the mass spectrometry image. Scale bar = 1 mm.

