Figure 2.
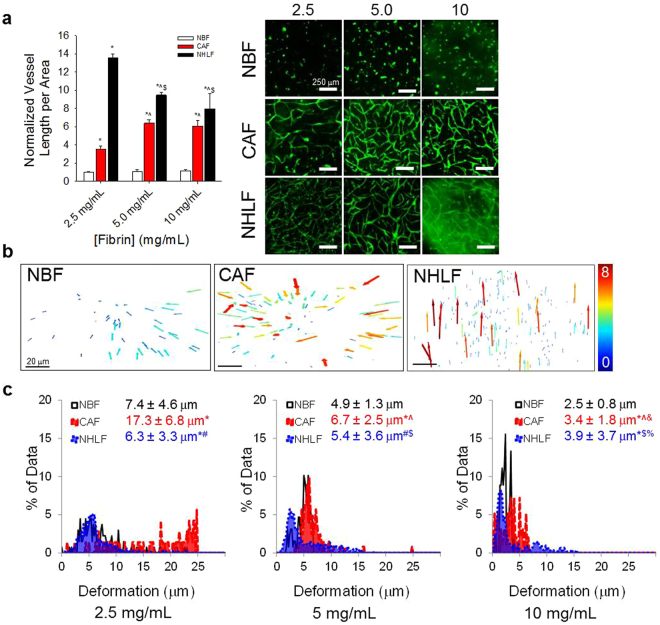
CAFs demonstrate mechanosensitive vascularization potential. (a) CAFs support enhanced levels of vascular growth over increasing fibrin gel compositions, with a significant increase seen from 2.5 mg/mL to 5.0 mg/mL samples. NHLF samples demonstrate the opposite effect, with significantly decreased vascularization potential as fibrin concentration increases over the same range. Data are presented as total vessel length per area, normalized to NBF samples in 2.5 mg/mL fibrin gels: 0.0017 ± 0.0001 μm−1. (Right) Immunofluorescent images of CD31 staining show vascular networks formed in the presence of CAFs and NHLFs, but not NBFs. *p < 0.01 vs. NBF at same fibrin concentration; ^p < 0.01 vs. CAF at 2.5 mg/mL fibrin; $p < 0.01 vs. NHLF at 2.5 mg/mL. Scale bars = 250 μm. (b) CAFs generate larger deformations in 3D gels compared to NBFs, as seen in 3D vector plots of bead displacements. Each arrow represents a tracked movement of a fiducial marker; color corresponds to magnitude as indicated by the scale bar (0–8 μm). Inset scale bars = 20 μm. (c) Data from vector maps is pooled from a minimum of 2 technical replicates, binned and plotted as histograms to show population behavior, where the y-axis represents the percent of data collected at a particular deformation value. Inset numbers are average deformation magnitudes ± standard deviation for each cell line. Each plot represents n > 40 bead movements tracked. CAFs demonstrate significantly larger deformations at all gel compositions compared to NBFs. CAFs have significantly larger averaged deformations compared to NHLFs at 2.5 and 5.0 mg/mL fibrin only. NHLFs exhibit larger deformations compared to NBFs in 5.0 mg/mL and 10 mg/mL fibrin gels,. *p < 0.01 vs. NBF at same fibrin concentration for average values; # vs. CAF at same fibrin concentration; ^p < 0.01 vs. CAF at 2.5 mg/mL fibrin; &p < 0.01 vs. CAF at 5.0 mg/mL; $p < 0.01 vs. NHLF at 2.5 mg/mL fibrin; %p < 0.01 vs. NHLF at 5.0 mg/mL fibrin. More statistical data can be found in Table S1.

