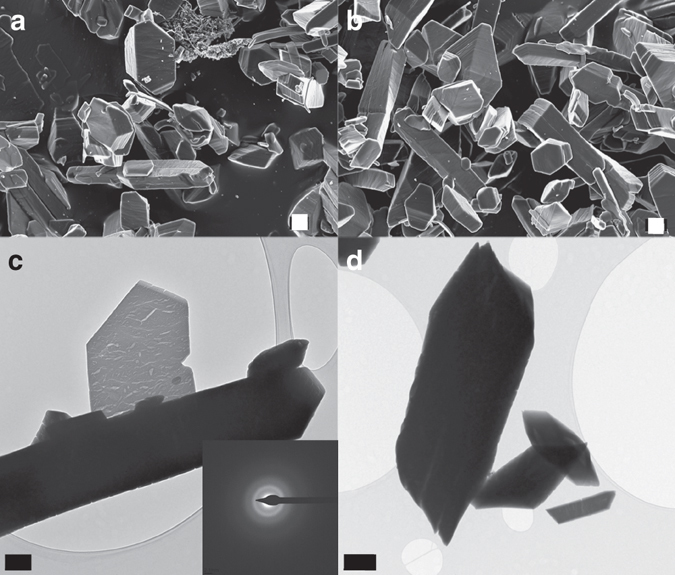
Fig. 3.

Characterization of calcium oxalate precipitates (control runs). FESEM (a, b) and TEM (c, d) images of calcium oxalate particles (mostly whewellite, according to our XRD analysis—see Supplementary Fig. 5) obtained after the titration experiments in the absence of citrate. The electron diffraction pattern of the crystals (shown as insets in c) suggests that decomposition of the beam-sensitive oxalate material results in amorphization. Scale bars: a 1 μm, b 1 μm, c 0.5 μm, and d 1 μm
